SageMaker PySpark PCA on Spark and K-Means Clustering on SageMaker MNIST Example
This notebook’s CI test result for us-west-2 is as follows. CI test results in other regions can be found at the end of the notebook.
Introduction
This notebook will show how to cluster handwritten digits through the SageMaker PySpark library.
We will manipulate data through Spark using a SparkSession, and then use the SageMaker Spark library to interact with SageMaker for training and inference. We will create a pipeline consisting of a first step to reduce the dimensionality using Spark MLLib PCA algorithm, followed by the final K-Means clustering step on SageMaker.
You can visit SageMaker Spark’s GitHub repository at https://github.com/aws/sagemaker-spark to learn more about SageMaker Spark.
This notebook was created and tested on an ml.m4.xlarge notebook instance.
Why use Spark MLLib algorithms?
The use of Spark MLLib PCA in this notebook is meant to showcase how you can use different pre-processting steps, ranging from data transformers to algorithms, with tools such as Spark MLLib that are well suited for data pre-processing. You can then use SageMaker algorithms and features through the SageMaker-Spark SDK. Here in our case, PCA is in charge of reducing the feature vector as a pre-processing step, and K-Means responsible for clustering the data.
Setup
First, we import the necessary modules and create the SparkSession with the SageMaker-Spark dependencies attached.
[ ]:
import os
import boto3

from pyspark import SparkContext, SparkConf
from pyspark.sql import SparkSession

import sagemaker
from sagemaker import get_execution_role
import sagemaker_pyspark

role = get_execution_role()

# Configure Spark to use the SageMaker Spark dependency jars
jars = sagemaker_pyspark.classpath_jars()

classpath = ":".join(sagemaker_pyspark.classpath_jars())

# See the SageMaker Spark Github to learn how to connect to EMR from a notebook instance
spark = (
    SparkSession.builder.config("spark.driver.extraClassPath", classpath)
    .master("local[*]")
    .getOrCreate()
)

spark
Loading the Data
Now, we load the MNIST dataset into a Spark Dataframe, which dataset is available in LibSVM format at
s3://sagemaker-sample-data-[region]/spark/mnist/
where [region] is replaced with a supported AWS region, such as us-east-1.
In order to train and make inferences our input DataFrame must have a column of Doubles (named “label” by default) and a column of Vectors of Doubles (named “features” by default).
Spark’s LibSVM DataFrameReader loads a DataFrame already suitable for training and inference.
Here, we load into a DataFrame in the SparkSession running on the local Notebook Instance, but you can connect your Notebook Instance to a remote Spark cluster for heavier workloads. Starting from EMR 5.11.0, SageMaker Spark is pre-installed on EMR Spark clusters. For more on connecting your SageMaker Notebook Instance to a remote EMR cluster, please see this blog post.
[ ]:
import boto3

cn_regions = ["cn-north-1", "cn-northwest-1"]
region = boto3.Session().region_name
endpoint_domain = "com.cn" if region in cn_regions else "com"
spark._jsc.hadoopConfiguration().set(
    "fs.s3a.endpoint", "s3.{}.amazonaws.{}".format(region, endpoint_domain)
)

trainingData = (
    spark.read.format("libsvm")
    .option("numFeatures", "784")
    .load("s3a://sagemaker-sample-data-{}/spark/mnist/train/".format(region))
)

testData = (
    spark.read.format("libsvm")
    .option("numFeatures", "784")
    .load("s3a://sagemaker-sample-data-{}/spark/mnist/test/".format(region))
)

trainingData.show()
MNIST images are 28x28, resulting in 784 pixels. The dataset consists of images of digits going from 0 to 9, representing 10 classes.
In each row: * The label column identifies the image’s label. For example, if the image of the handwritten number is the digit 5, the label value is 5. * The features column stores a vector (org.apache.spark.ml.linalg.Vector) of Double values. The length of the vector is 784, as each image consists of 784 pixels. Those pixels are the features we will use.
As we are interested in clustering the images of digits, the number of pixels represents the feature vector, while the number of classes represents the number of clusters we want to find.
Create a hybrid pipeline with Spark PCA and SageMaker K-Means
To perform the clustering task, we will first running PCA on our feature vector, reducing it to 50 features. Then, we can use K-Means on the result of PCA to apply the final clustering. We will create a Pipeline consisting of 2 stages: the PCA stage, and the K-Means stage.
In the following example, we run PCA on our Spark cluster, then train and infer using Amazon SageMaker’s K-Means on the output column from PCA:
[ ]:
from pyspark.ml import Pipeline
from pyspark.ml.feature import PCA

from sagemaker_pyspark.algorithms import KMeansSageMakerEstimator
from sagemaker_pyspark import IAMRole, EndpointCreationPolicy, RandomNamePolicyFactory
from sagemaker_pyspark.transformation.serializers import ProtobufRequestRowSerializer

# ML pipeline with 2 stages: PCA and K-Means

# 1st stage: PCA
pcaSparkEstimator = PCA(inputCol="features", outputCol="projectedFeatures", k=50)

# 2nd stage: K-Means on SageMaker
kMeansSageMakerEstimator = KMeansSageMakerEstimator(
    sagemakerRole=IAMRole(role),
    trainingSparkDataFormatOptions={
        "featuresColumnName": "projectedFeatures"
    },  # use the output column of PCA
    requestRowSerializer=ProtobufRequestRowSerializer(
        featuresColumnName="projectedFeatures"
    ),  # use the output column of PCA
    trainingInstanceType="ml.m4.xlarge",
    trainingInstanceCount=1,
    endpointInstanceType="ml.t2.medium",
    endpointInitialInstanceCount=1,
    namePolicyFactory=RandomNamePolicyFactory("sparksm-2-"),
    endpointCreationPolicy=EndpointCreationPolicy.CREATE_ON_TRANSFORM,
)

# Set parameters for K-Means
kMeansSageMakerEstimator.setFeatureDim(50)
kMeansSageMakerEstimator.setK(10)

# Define the stages of the Pipeline in order
pipelineSparkSM = Pipeline(stages=[pcaSparkEstimator, kMeansSageMakerEstimator])
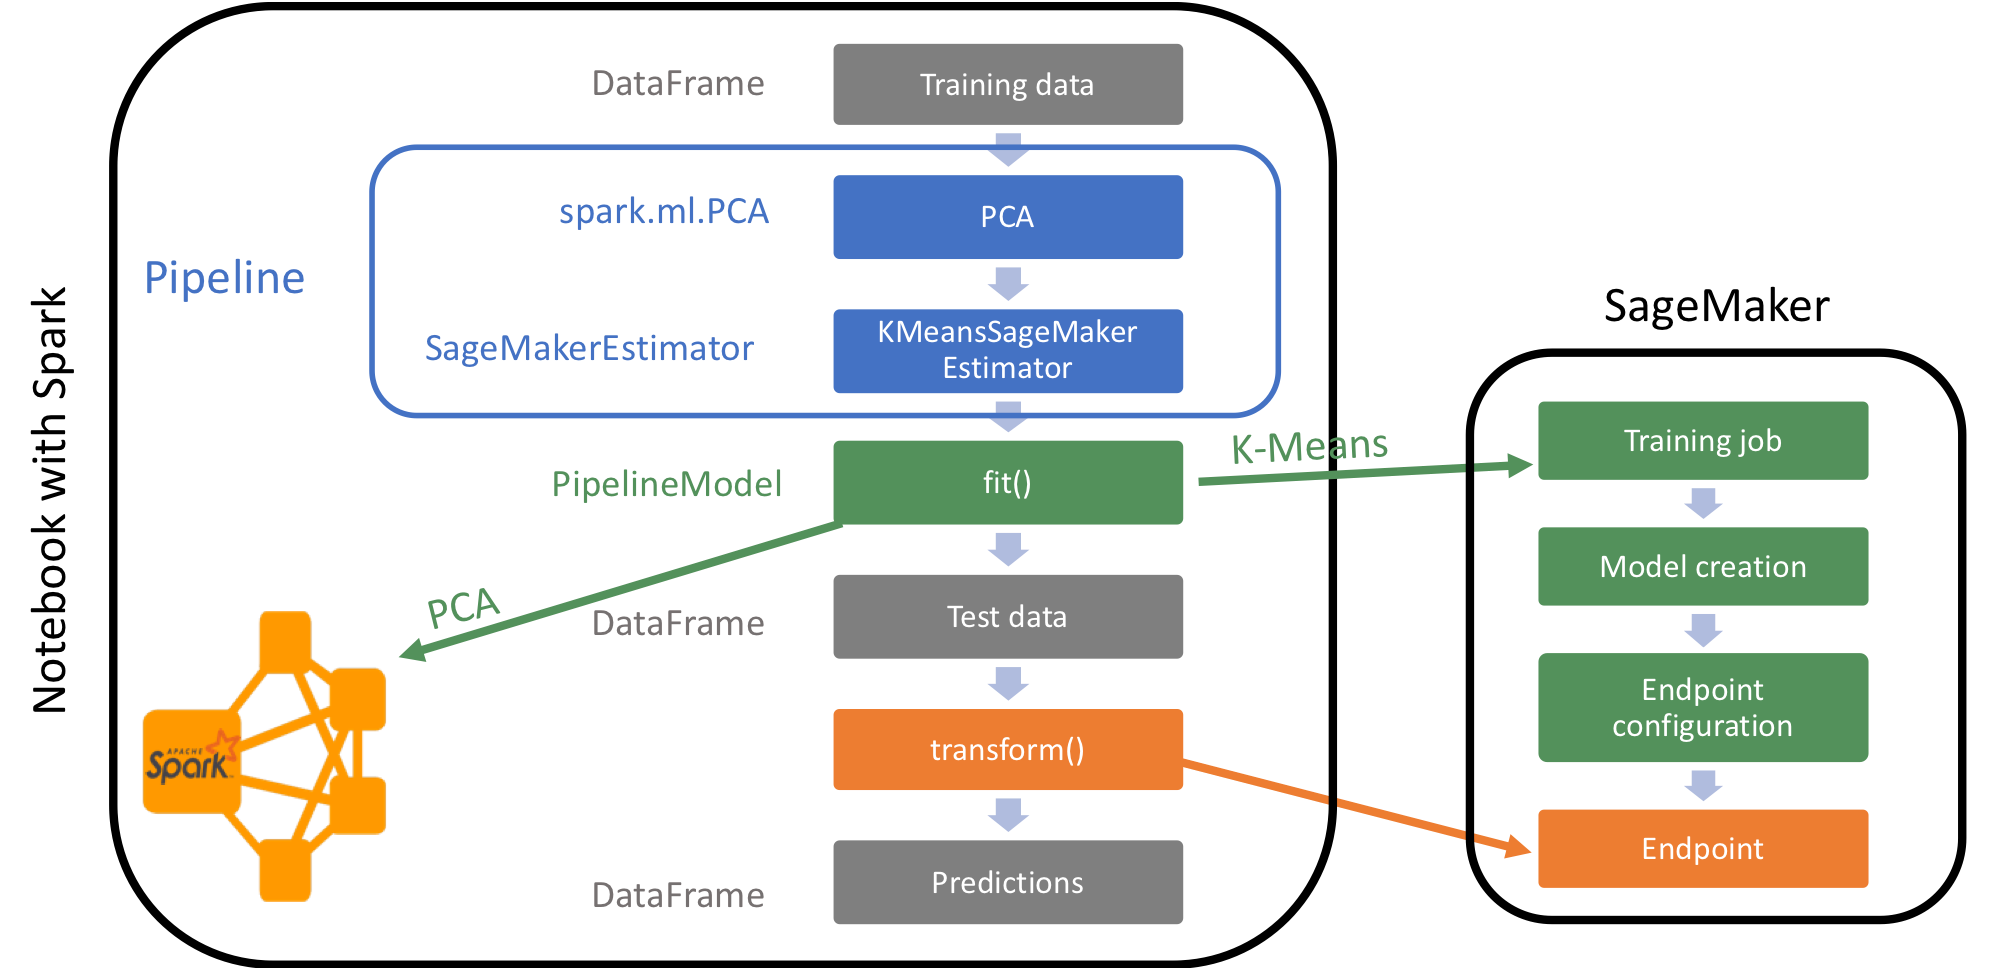
To put this pipeline back into context, let’s look at the below architecture that shows what actually runs on the notebook instance (with Spark) and on SageMaker.
Now that we’ve defined the Pipeline, we can call fit on the training data. Please note the below code will take several minutes to run and create all the resources needed for this pipeline.
[ ]:
# Train
pipelineModelSparkSM = pipelineSparkSM.fit(trainingData)
When we call fit on the pipeline, first the DataFrame will run through the PCA algorithm provided by Spark. The result of the PCA run will be output to the projectedFeatures column of the DataFrame. Then, the KMeansSageMakerEstimator takes the resulting DataFrame and runs the training on SageMaker using the provided K-Means algorithm. As we used EndpointCreationPolicy.CREATE_ON_TRANSFORM, only the training job will run on fit. The model and endpoint will be created once we call
transform.
We’ve introduced new parameters in the KMeansSageMakerEstimator: * trainingSparkDataFormatOptions = {"featuresColumnName": "projectedFeatures"} configures Spark to serialize the “projectedFeatures” column for model training * requestRowSerializer = ProtobufRequestRowSerializer(featuresColumnName = "projectedFeatures") configures the KMeansModel contained within the PipelineModel returned by fit() to infer on the features in the “projectedFeatures” column generated by the PCA step
Inference
Let’s use our test data on our pipeline by calling transform. Please note the below code will take several minutes to run and create the endpoint needed in order to serve this pipeline.
[ ]:
# Run predictions
transformedData = pipelineModelSparkSM.transform(testData)
transformedData.show()
How well did the pipeline perform? Let us display the digits from each of the clusters and manually inspect the results:
[ ]:
from pyspark.sql.types import DoubleType
import matplotlib.pyplot as plt
import numpy as np
import string

# Helper function to display a digit
def showDigit(img, caption="", xlabel="", subplot=None):
    if subplot == None:
        _, (subplot) = plt.subplots(1, 1)
    imgr = img.reshape((28, 28))
    subplot.axes.get_xaxis().set_ticks([])
    subplot.axes.get_yaxis().set_ticks([])
    plt.title(caption)
    plt.xlabel(xlabel)
    subplot.imshow(imgr, cmap="gray")


def displayClusters(data):
    images = np.array(data.select("features").cache().take(250))
    clusters = data.select("closest_cluster").cache().take(250)

    for cluster in range(10):
        print("\n\n\nCluster {}:".format(string.ascii_uppercase[cluster]))
        digits = [img for l, img in zip(clusters, images) if int(l.closest_cluster) == cluster]
        height = ((len(digits) - 1) // 5) + 1
        width = 5
        plt.rcParams["figure.figsize"] = (width, height)
        _, subplots = plt.subplots(height, width)
        subplots = np.ndarray.flatten(subplots)
        for subplot, image in zip(subplots, digits):
            showDigit(image, subplot=subplot)
        for subplot in subplots[len(digits) :]:
            subplot.axis("off")

        plt.show()


displayClusters(transformedData)
Clean-up
Since we don’t need to make any more inferences, now we delete the resources (endpoints, models, configurations, etc):
[ ]:
# Delete the resources
from sagemaker_pyspark import SageMakerResourceCleanup
from sagemaker_pyspark import SageMakerModel


def cleanUp(model):
    resource_cleanup = SageMakerResourceCleanup(model.sagemakerClient)
    resource_cleanup.deleteResources(model.getCreatedResources())


# Delete the SageMakerModel in pipeline
for m in pipelineModelSparkSM.stages:
    if isinstance(m, SageMakerModel):
        cleanUp(m)
More on SageMaker Spark
The SageMaker Spark Github repository has more about SageMaker Spark, including how to use SageMaker Spark using the Scala SDK: https://github.com/aws/sagemaker-spark
Notebook CI Test Results
This notebook was tested in multiple regions. The test results are as follows, except for us-west-2 which is shown at the top of the notebook.