SageMaker PySpark PCA and K-Means Clustering MNIST Example
This notebook’s CI test result for us-west-2 is as follows. CI test results in other regions can be found at the end of the notebook.
Introduction
This notebook will show how to cluster handwritten digits through the SageMaker PySpark library.
We will manipulate data through Spark using a SparkSession, and then use the SageMaker Spark library to interact with SageMaker for training and inference. We will create a pipeline consisting of a first step to reduce the dimensionality using SageMaker’s PCA algorithm, followed by the final K-Means clustering step on SageMaker.
You can visit SageMaker Spark’s GitHub repository at https://github.com/aws/sagemaker-spark to learn more about SageMaker Spark.
This notebook was created and tested on an ml.m4.xlarge notebook instance.
Setup
First, we import the necessary modules and create the SparkSession with the SageMaker-Spark dependencies attached.
[ ]:
import os
import boto3

from pyspark import SparkContext, SparkConf
from pyspark.sql import SparkSession

import sagemaker
from sagemaker import get_execution_role
import sagemaker_pyspark

role = get_execution_role()

# Configure Spark to use the SageMaker Spark dependency jars
jars = sagemaker_pyspark.classpath_jars()

classpath = ":".join(sagemaker_pyspark.classpath_jars())

# See the SageMaker Spark Github to learn how to connect to EMR from a notebook instance
spark = (
    SparkSession.builder.config("spark.driver.extraClassPath", classpath)
    .master("local[*]")
    .getOrCreate()
)

spark
Loading the Data
Now, we load the MNIST dataset into a Spark Dataframe, which dataset is available in LibSVM format at
s3://sagemaker-sample-data-[region]/spark/mnist/
where [region] is replaced with a supported AWS region, such as us-east-1.
In order to train and make inferences our input DataFrame must have a column of Doubles (named “label” by default) and a column of Vectors of Doubles (named “features” by default).
Spark’s LibSVM DataFrameReader loads a DataFrame already suitable for training and inference.
Here, we load into a DataFrame in the SparkSession running on the local Notebook Instance, but you can connect your Notebook Instance to a remote Spark cluster for heavier workloads. Starting from EMR 5.11.0, SageMaker Spark is pre-installed on EMR Spark clusters. For more on connecting your SageMaker Notebook Instance to a remote EMR cluster, please see this blog post.
[ ]:
import boto3

cn_regions = ["cn-north-1", "cn-northwest-1"]
region = boto3.Session().region_name
endpoint_domain = "com.cn" if region in cn_regions else "com"
spark._jsc.hadoopConfiguration().set(
    "fs.s3a.endpoint", "s3.{}.amazonaws.{}".format(region, endpoint_domain)
)

trainingData = (
    spark.read.format("libsvm")
    .option("numFeatures", "784")
    .load("s3a://sagemaker-sample-data-{}/spark/mnist/train/".format(region))
)

testData = (
    spark.read.format("libsvm")
    .option("numFeatures", "784")
    .load("s3a://sagemaker-sample-data-{}/spark/mnist/test/".format(region))
)

trainingData.show()
MNIST images are 28x28, resulting in 784 pixels. The dataset consists of images of digits going from 0 to 9, representing 10 classes.
In each row: * The label column identifies the image’s label. For example, if the image of the handwritten number is the digit 5, the label value is 5. * The features column stores a vector (org.apache.spark.ml.linalg.Vector) of Double values. The length of the vector is 784, as each image consists of 784 pixels. Those pixels are the features we will use.
As we are interested in clustering the images of digits, the number of pixels represents the feature vector, while the number of classes represents the number of clusters we want to find.
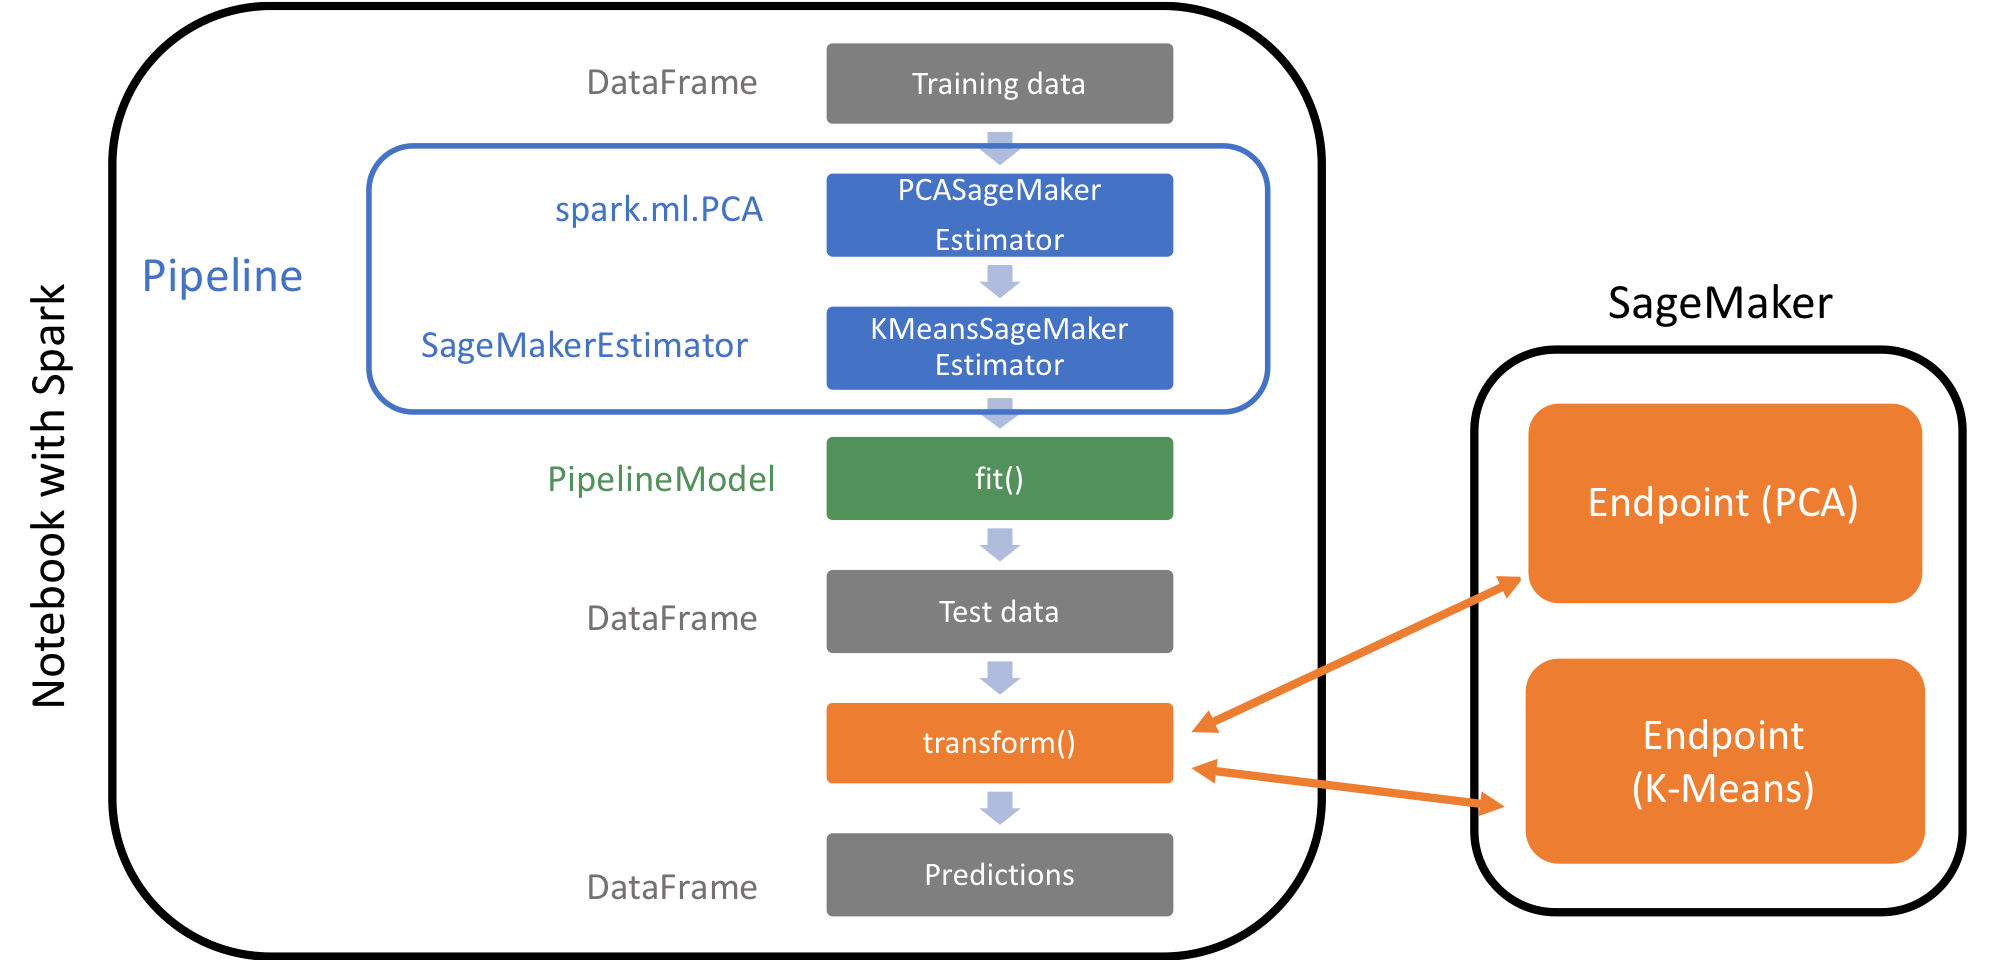
Create a pipeline with PCA and K-Means on SageMaker
To perform the clustering task, we will first running PCA on our feature vector, reducing it to 50 features. Then, we can use K-Means on the result of PCA to apply the final clustering. We will create a Pipeline consisting of 2 stages: the PCA stage, and the K-Means stage.
In the following example, we run the pipeline fully on SageMaker infrastructure, making use of both PCASageMakerEstimator and KMeansSageMakerEstimator. The PCA training and inference step will run on SageMaker, and then we can train and infer using Amazon SageMaker’s K-Means on the output column from PCA:
[ ]:
from pyspark.ml import Pipeline

from sagemaker_pyspark.algorithms import PCASageMakerEstimator, KMeansSageMakerEstimator
from sagemaker_pyspark import RandomNamePolicyFactory, IAMRole, EndpointCreationPolicy
from sagemaker_pyspark.transformation.serializers import ProtobufRequestRowSerializer

# ML pipeline with 2 stages: PCA and K-Means

# 1st stage: PCA on SageMaker
pcaSageMakerEstimator = PCASageMakerEstimator(
    sagemakerRole=IAMRole(role),
    trainingInstanceType="ml.m4.xlarge",
    trainingInstanceCount=1,
    endpointInstanceType="ml.t2.large",
    endpointInitialInstanceCount=1,
    namePolicyFactory=RandomNamePolicyFactory("sparksm-3p-"),
)

# Set parameters for PCA (number of features in input and the number of principal components to find)
pcaSageMakerEstimator.setFeatureDim(784)
pcaSageMakerEstimator.setNumComponents(50)

# 2nd stage: K-Means on SageMaker
kMeansSageMakerEstimator = KMeansSageMakerEstimator(
    sagemakerRole=IAMRole(role),
    trainingSparkDataFormatOptions={
        "featuresColumnName": "projection"
    },  # Default output column generated by PCASageMakerEstimator
    requestRowSerializer=ProtobufRequestRowSerializer(
        featuresColumnName="projection"
    ),  # Default output column generated by PCASageMakerEstimator
    trainingInstanceType="ml.m4.xlarge",
    trainingInstanceCount=1,
    endpointInstanceType="ml.t2.large",
    endpointInitialInstanceCount=1,
    namePolicyFactory=RandomNamePolicyFactory("sparksm-3k-"),
    endpointCreationPolicy=EndpointCreationPolicy.CREATE_ON_TRANSFORM,
)

# Set parameters for K-Means
kMeansSageMakerEstimator.setFeatureDim(50)
kMeansSageMakerEstimator.setK(10)

# Define the stages of the Pipeline in order
pipelineSM = Pipeline(stages=[pcaSageMakerEstimator, kMeansSageMakerEstimator])
Now that we’ve defined the Pipeline, we can call fit on the training data. Please note the below code will take several minutes to run and create all the resources needed for this pipeline.
[ ]:
# Train
pipelineModelSM = pipelineSM.fit(trainingData)
In this case, when calling fit on the PipelineModel, 2 jobs and models will be created: 1. A job using the PCA algorithm which will create a PCA model 2. A job using the K-Means algorithm which will create a K-Means model
As the stages were defined in the pipeline, the pipeline is responsible for giving as input to the PCA job the raw data, and then giving as input to the K-Means job the results of the PCA job.
Please note that the endpoint serving the PCA model is created when calling fit, as the endpoint is needed to be generate the input to train the K-means algorithm and thus launch the job. In this setting, only the K-Means endpoint will be created when calling transform, as stated by the endpointCreationPolicy given to the KMeansSageMakerEstimator, in order to reduce the waiting time when calling fit.
Inference
When calling the transform method on the PipelineModel object, both the PCA and K-Means SageMaker endpoints are contacted sequentially. We can see this in the below architecture diagram.
Please note the below code will take several minutes to run and create the final K-Means endpoint needed for this pipeline.
[ ]:
transformedData = pipelineModelSM.transform(testData)
transformedData.show()
How well did the pipeline perform? Let us display the digits from each of the clusters and manually inspect the results:
[ ]:
from pyspark.sql.types import DoubleType
import matplotlib.pyplot as plt
import numpy as np
import string

# Helper function to display a digit
def showDigit(img, caption="", xlabel="", subplot=None):
    if subplot == None:
        _, (subplot) = plt.subplots(1, 1)
    imgr = img.reshape((28, 28))
    subplot.axes.get_xaxis().set_ticks([])
    subplot.axes.get_yaxis().set_ticks([])
    plt.title(caption)
    plt.xlabel(xlabel)
    subplot.imshow(imgr, cmap="gray")


def displayClusters(data):
    images = np.array(data.select("features").cache().take(250))
    clusters = data.select("closest_cluster").cache().take(250)

    for cluster in range(10):
        print("\n\n\nCluster {}:".format(string.ascii_uppercase[cluster]))
        digits = [img for l, img in zip(clusters, images) if int(l.closest_cluster) == cluster]
        height = ((len(digits) - 1) // 5) + 1
        width = 5
        plt.rcParams["figure.figsize"] = (width, height)
        _, subplots = plt.subplots(height, width)
        subplots = np.ndarray.flatten(subplots)
        for subplot, image in zip(subplots, digits):
            showDigit(image, subplot=subplot)
        for subplot in subplots[len(digits) :]:
            subplot.axis("off")

        plt.show()


displayClusters(transformedData)
Clean-up
Since we don’t need to make any more inferences, now we delete the resources (endpoints, models, configurations, etc):
[ ]:
# Delete the resources
from sagemaker_pyspark import SageMakerResourceCleanup
from sagemaker_pyspark import SageMakerModel


def cleanUp(model):
    resource_cleanup = SageMakerResourceCleanup(model.sagemakerClient)
    resource_cleanup.deleteResources(model.getCreatedResources())


# Delete the SageMakerModel in pipeline
for m in pipelineModelSM.stages:
    if isinstance(m, SageMakerModel):
        cleanUp(m)
More on SageMaker Spark
The SageMaker Spark Github repository has more about SageMaker Spark, including how to use SageMaker Spark using the Scala SDK: https://github.com/aws/sagemaker-spark
Notebook CI Test Results
This notebook was tested in multiple regions. The test results are as follows, except for us-west-2 which is shown at the top of the notebook.