SageMaker PySpark Custom Estimator MNIST Example
This notebook’s CI test result for us-west-2 is as follows. CI test results in other regions can be found at the end of the notebook.
Introduction
This notebook will show how to cluster handwritten digits through the SageMaker PySpark library.
We will manipulate data through Spark using a SparkSession, and then use the SageMaker Spark library to interact with SageMaker for training and inference. We will use a custom estimator to perform the classification task, and train and infer using that custom estimator.
You can visit SageMaker Spark’s GitHub repository at https://github.com/aws/sagemaker-spark to learn more about SageMaker Spark.
This notebook was created and tested on an ml.m4.xlarge notebook instance.
Setup
First, we import the necessary modules and create the SparkSession with the SageMaker-Spark dependencies attached.
[ ]:
import os
import boto3

from pyspark import SparkContext, SparkConf
from pyspark.sql import SparkSession

import sagemaker
from sagemaker import get_execution_role
import sagemaker_pyspark

role = get_execution_role()

# Configure Spark to use the SageMaker Spark dependency jars
jars = sagemaker_pyspark.classpath_jars()

classpath = ":".join(sagemaker_pyspark.classpath_jars())

# See the SageMaker Spark Github to learn how to connect to EMR from a notebook instance
spark = (
    SparkSession.builder.config("spark.driver.extraClassPath", classpath)
    .master("local[*]")
    .getOrCreate()
)

spark
Loading the Data
Now, we load the MNIST dataset into a Spark Dataframe, which dataset is available in LibSVM format at
s3://sagemaker-sample-data-[region]/spark/mnist/
where [region] is replaced with a supported AWS region, such as us-east-1.
In order to train and make inferences our input DataFrame must have a column of Doubles (named “label” by default) and a column of Vectors of Doubles (named “features” by default).
Spark’s LibSVM DataFrameReader loads a DataFrame already suitable for training and inference.
Here, we load into a DataFrame in the SparkSession running on the local Notebook Instance, but you can connect your Notebook Instance to a remote Spark cluster for heavier workloads. Starting from EMR 5.11.0, SageMaker Spark is pre-installed on EMR Spark clusters. For more on connecting your SageMaker Notebook Instance to a remote EMR cluster, please see this blog post.
[ ]:
import boto3

cn_regions = ["cn-north-1", "cn-northwest-1"]
region = boto3.Session().region_name
endpoint_domain = "com.cn" if region in cn_regions else "com"
spark._jsc.hadoopConfiguration().set(
    "fs.s3a.endpoint", "s3.{}.amazonaws.{}".format(region, endpoint_domain)
)

trainingData = (
    spark.read.format("libsvm")
    .option("numFeatures", "784")
    .load("s3a://sagemaker-sample-data-{}/spark/mnist/train/".format(region))
)

testData = (
    spark.read.format("libsvm")
    .option("numFeatures", "784")
    .load("s3a://sagemaker-sample-data-{}/spark/mnist/test/".format(region))
)

trainingData.show()
MNIST images are 28x28, resulting in 784 pixels. The dataset consists of images of digits going from 0 to 9, representing 10 classes.
In each row: * The label column identifies the image’s label. For example, if the image of the handwritten number is the digit 5, the label value is 5. * The features column stores a vector (org.apache.spark.ml.linalg.Vector) of Double values. The length of the vector is 784, as each image consists of 784 pixels. Those pixels are the features we will use.
As we are interested in clustering the images of digits, the number of pixels represents the feature vector, while the number of classes represents the number of clusters we want to find.
Create a custom SageMakerEstimator
SageMaker-Spark provides several classes that extend SageMakerEstimator to use SageMaker-provided algorithms, like KMeansSageMakerEstimator to run the SageMaker-provided K-Means algorithm. These classes are SageMakerEstimator with certain default values passed in. You can use SageMaker-Spark with any algorithm (provided by Amazon or your own model) that runs on Amazon SageMaker by creating a SageMakerEstimator.
In this example, we’ll re-create the KMeansSageMakerEstimator into an equivalent SageMakerEstimator.
[ ]:
from sagemaker.amazon.amazon_estimator import get_image_uri
from sagemaker_pyspark import SageMakerEstimator
from sagemaker_pyspark.transformation.deserializers import KMeansProtobufResponseRowDeserializer
from sagemaker_pyspark.transformation.serializers import ProtobufRequestRowSerializer
from sagemaker_pyspark import IAMRole
from sagemaker_pyspark import RandomNamePolicyFactory
from sagemaker_pyspark import EndpointCreationPolicy

# Create an Estimator from scratch
estimator = SageMakerEstimator(
    trainingImage=get_image_uri(region, "kmeans"),  # Training image
    modelImage=get_image_uri(region, "kmeans"),  # Model image
    requestRowSerializer=ProtobufRequestRowSerializer(),
    responseRowDeserializer=KMeansProtobufResponseRowDeserializer(),
    hyperParameters={"k": "10", "feature_dim": "784"},  # Set parameters for K-Means
    sagemakerRole=IAMRole(role),
    trainingInstanceType="ml.m4.xlarge",
    trainingInstanceCount=1,
    endpointInstanceType="ml.t2.medium",
    endpointInitialInstanceCount=1,
    trainingSparkDataFormat="sagemaker",
    namePolicyFactory=RandomNamePolicyFactory("sparksm-4-"),
    endpointCreationPolicy=EndpointCreationPolicy.CREATE_ON_TRANSFORM,
)
The main parts of a SageMakerEstimator are: * trainingImage: the Docker Registry path where the training image is hosted - can be a custom Docker image hosting your own model, or one of the Amazon provided images * modelImage: the Docker Registry path where the inference image is used - can be a custom Docker image hosting your own model, or one of the Amazon provided
images * hyperparameters: the hyper-parameters of the algorithm being created - the values passed in need to be of type string
To put this SageMakerEstimator back into context, let’s look at the below architecture that shows what actually runs on the notebook instance and on SageMaker.
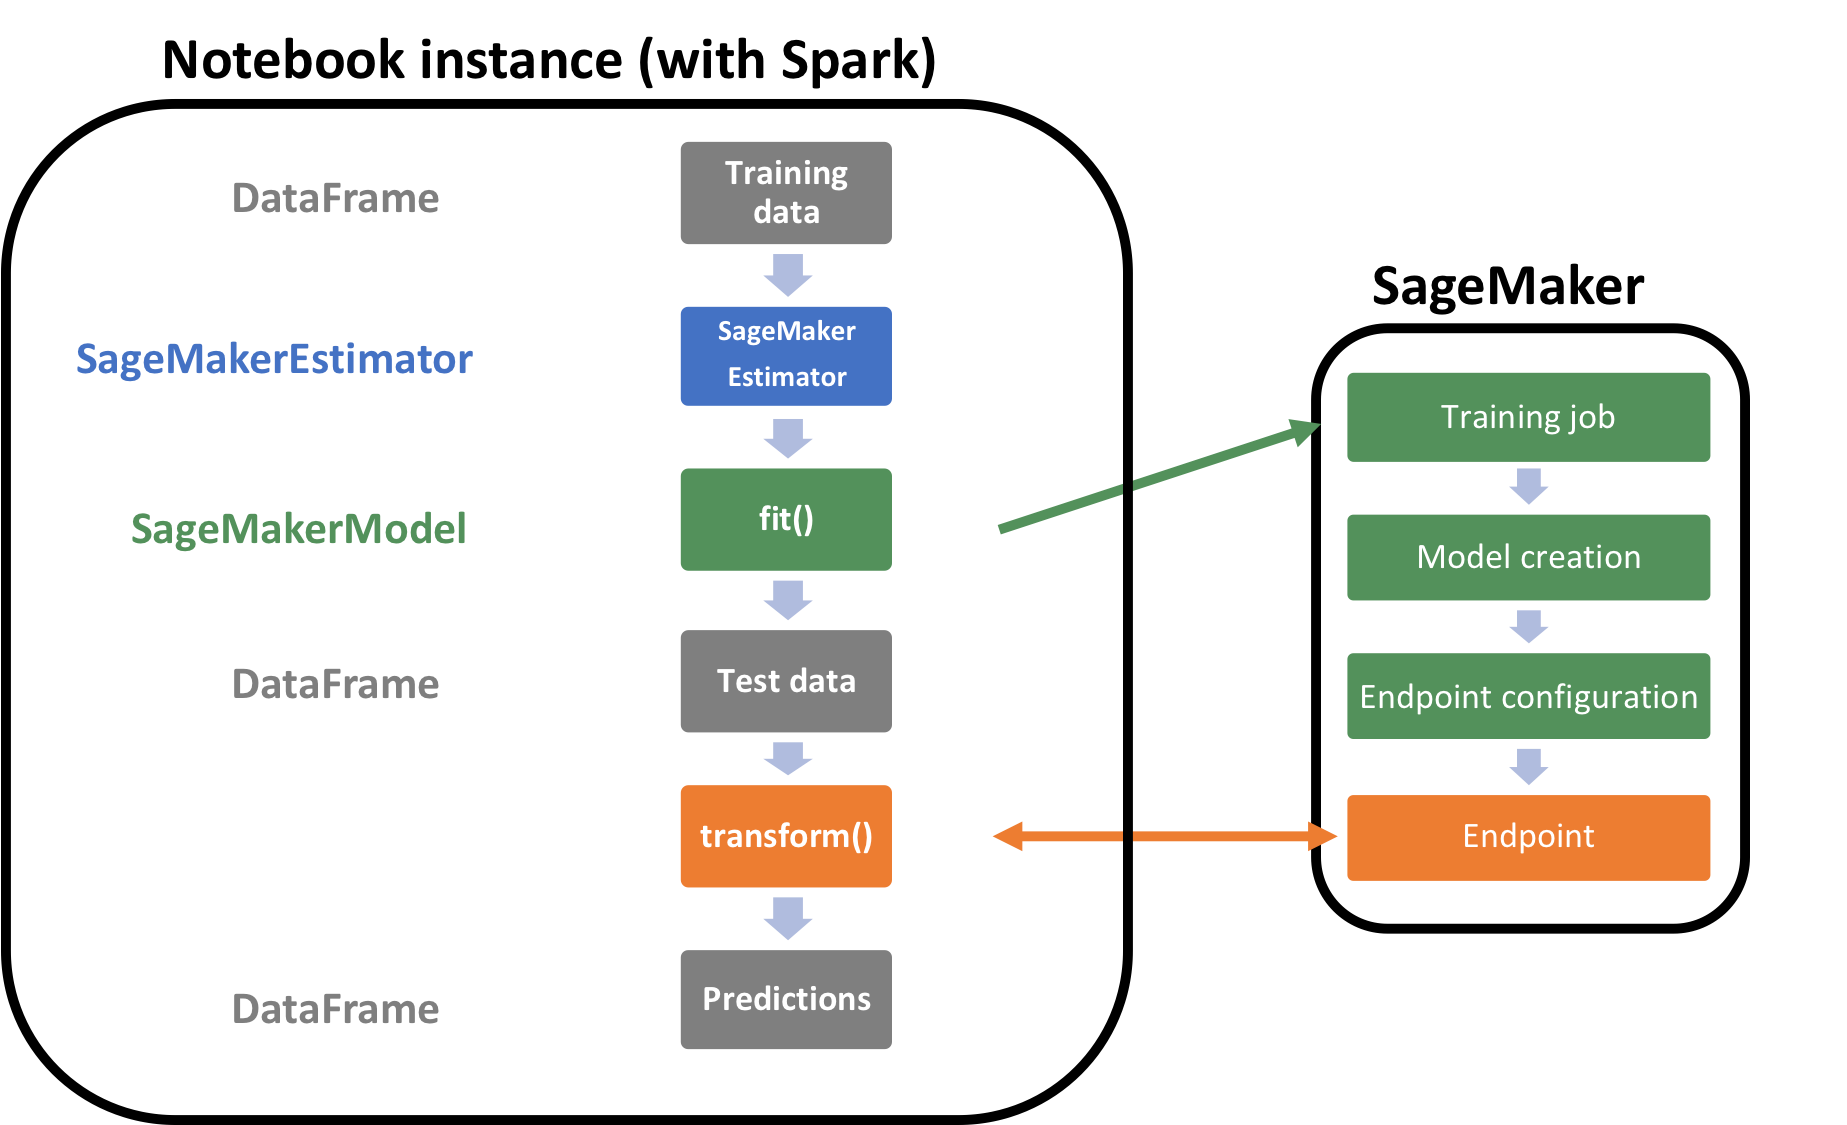
Let’s train this estimator by calling fit on it with the training data. Please note the below code will take several minutes to run and create all the resources needed for this model.
[ ]:
customModel = estimator.fit(trainingData)
Inference
Now we transform our DataFrame. To do this, we serialize each row’s “features” Vector of Doubles into a Protobuf format for inference against the Amazon SageMaker Endpoint. We deserialize the Protobuf responses back into our DataFrame. This serialization and deserialization is handled automatically by the transform() method:
[ ]:
transformedData = customModel.transform(testData)
transformedData.show()
How well did the custom algorithm perform? Let us display the digits from each of the clusters and manually inspect the results:
[ ]:
from pyspark.sql.types import DoubleType
import matplotlib.pyplot as plt
import numpy as np
import string

# Helper function to display a digit
def showDigit(img, caption="", xlabel="", subplot=None):
    if subplot == None:
        _, (subplot) = plt.subplots(1, 1)
    imgr = img.reshape((28, 28))
    subplot.axes.get_xaxis().set_ticks([])
    subplot.axes.get_yaxis().set_ticks([])
    plt.title(caption)
    plt.xlabel(xlabel)
    subplot.imshow(imgr, cmap="gray")


def displayClusters(data):
    images = np.array(data.select("features").cache().take(250))
    clusters = data.select("closest_cluster").cache().take(250)

    for cluster in range(10):
        print("\n\n\nCluster {}:".format(string.ascii_uppercase[cluster]))
        digits = [img for l, img in zip(clusters, images) if int(l.closest_cluster) == cluster]
        height = ((len(digits) - 1) // 5) + 1
        width = 5
        plt.rcParams["figure.figsize"] = (width, height)
        _, subplots = plt.subplots(height, width)
        subplots = np.ndarray.flatten(subplots)
        for subplot, image in zip(subplots, digits):
            showDigit(image, subplot=subplot)
        for subplot in subplots[len(digits) :]:
            subplot.axis("off")

        plt.show()


displayClusters(transformedData)
Clean-up
Since we don’t need to make any more inferences, now we delete the resources (endpoints, models, configurations, etc):
[ ]:
# Delete the resources
from sagemaker_pyspark import SageMakerResourceCleanup


def cleanUp(model):
    resource_cleanup = SageMakerResourceCleanup(model.sagemakerClient)
    resource_cleanup.deleteResources(model.getCreatedResources())


cleanUp(customModel)
More on SageMaker Spark
The SageMaker Spark Github repository has more about SageMaker Spark, including how to use SageMaker Spark using the Scala SDK: https://github.com/aws/sagemaker-spark
Notebook CI Test Results
This notebook was tested in multiple regions. The test results are as follows, except for us-west-2 which is shown at the top of the notebook.