Build a Customer Churn Model for Music Streaming App Users: Model Selection and Model Explainability
This notebook’s CI test result for us-west-2 is as follows. CI test results in other regions can be found at the end of the notebook.
Background
This notebook is one of a sequence of notebooks that show you how to use various SageMaker functionalities to build, train, and deploy the model from end to end, including data pre-processing steps like ingestion, cleaning and processing, feature engineering, training and hyperparameter tuning, model explainability, and eventually deploy the model. There are two parts of the demo:
Build a Customer Churn Model for Music Streaming App Users: Overview and Data Preparation - you will process the data with the help of Data Wrangler, then create features from the cleaned data. By the end of part 1, you will have a complete feature data set that contains all attributes built for each user, and it is ready for modeling.
Build a Customer Churn Model for Music Streaming App Users: Model Selection and Model Explainability (current notebook) - you will use the data set built from part 1 to find an optimal model for the use case, then test the model predictability with the test data.
For how to set up the SageMaker Studio Notebook environment, please check the onboarding video. And for a list of services covered in the use case demo, please check the documentation linked in each section.
Content
Overview
What is Customer Churn and why is it important for businesses?
Customer churn, or customer retention/attrition, means a customer has the tendency to leave and stop paying for a business. It is one of the primary metrics companies want to track to get a sense of their customer satisfaction, especially for a subscription-based business model. The company can track churn rate (defined as the percentage of customers churned during a period) as a health indicator for the business, but we would love to identify the at-risk customers before they churn and offer appropriate treatment to keep them with the business, and this is where machine learning comes into play. ### Use Cases for Customer Churn
Any subscription-based business would track customer churn as one of the most critical Key Performance Indicators (KPIs). Such companies and industries include Telecom companies (cable, cell phone, internet, etc.), digital subscriptions of media (news, forums, blogposts platforms, etc.), music and video streaming services, and other Software as a Service (SaaS) providers (e-commerce, CRM, Mar-Tech, cloud computing, video conference provider, and visualization and data science tools, etc.)
Define Business problem
To start with, here are some common business problems to consider depending on your specific use cases and your focus:
Will this customer churn (cancel the plan, cancel the subscription)?
Will this customer downgrade a pricing plan?
For a subscription business model, will a customer renew his/her subscription?
Machine learning problem formulation
Classification: will this customer churn?
To goal of classification is to identify the at-risk customers and sometimes their unusual behavior, such as: will this customer churn or downgrade their plan? Is there any unusual behavior for a customer? The latter question can be formulated as an anomaly detection problem.
Time Series: will this customer churn in the next X months? When will this customer churn?
You can further explore your users by formulating the problem as a time series one and detect when will the customer churn.
Data Requirements
Data collection Sources
Some most common data sources used to construct a data set for churn analysis are: * Customer Relationship Management platform (CRM), * engagement and usage data (analytics services), * passive feedback (ratings based on your request), and active feedback (customer support request, feedback on social media and review platforms).
Construct a Data Set for Churn Analysis
Most raw data collected from the sources mentioned above are huge and often needs a lot of cleaning and pre-processing. For example, usage data is usually event-based log data and can be more than a few gigabytes every day; you can aggregate the data to user-level daily for further analysis. Feedback and review data are mostly text data, so you would need to clean and pre-process the natural language data to be normalized, machine-readable data. If you are joining multiple data sources (especially from different platforms) together, you would want to make sure all data points are consistent, and the user identity can be matched across different platforms.
Challenges with Customer Churn
Business related
Importance of domain knowledge: this is critical when you start building features for the machine learning model. It is important to understand the business enough to decide which features would trigger retention.
Data issues
fewer churn data available (imbalanced classes): data for churn analysis is often very imbalanced as most of the customers of a business are happy customers (usually).
User identity mapping problem: if you are joining data from different platforms (CRM, email, feedback, mobile app, and website usage data), you would want to make sure user A is recognized as the same user across multiple platforms. There are third-party solutions that help you tackle this problem.
Not collecting the right data for the use case or Lacking enough data
Model Selection
You can experiment with all your model choices and see which one gives better results. A few things to note when you choose algorithms: * Start with simple ones: Usually for tabular data classification that does not contain complex unstructured data (text, audio, image, etc.), you can start with logistic regression to see how your data performs, as sometimes the simplest model gives great results if your data have a strong linear pattern.
Think about your data structure: For imbalanced class data like churn analysis, you can experiment with tree-based models like the random forest, gradient boosting, or XGboost since they are less sensitive to class imbalance.
Interpretability: logistic regression model generally has better interpretability because of its linearity. You can also use feature importance from tree-based models or Support Vector Machines as an overall observation, but not to your predicting instance level. Instead, you can utilize tools like SHAP or the SageMaker new feature SageMaker Clarify to better visualize which feature contributing more to your prediction results.
In this use case, a tree-based model XGBoost is chosen due to consideration of imbalanced class, and in the family of tree based models, XGBoost usually gives best results as its built for model performance and computational speed.
Training with SageMaker Estimator and Experiment
Once you decide on a range of models you want to experiment with, you can start training and comparing model results to choose the best one. A few things left for you to make a decision: * SageMaker estimator configuration * to initialize your training job, you would need to config your SageMaker estimator and SageMaker training image by specifying the model choice, instance size, and type. * Choose evaluation methods * You can check the model parameter documentation page for all the evaluation metrics you can choose for a model. For a imbalanced classification problem, you can choose F1 as your evaluation especially for comparing different models; area under curve (auc) is also a good choice when your output is probability. * Hyper-parameters * You can look at the documentation for a complete list of hyper-parameters tunable for the model (The XGBoost model here was given as an example). For best performances, you can experiment with a range of combinations for the hyper-parameters and compare the validation results.
How to create a training job as a trial in SageMaker Experiment
Get ECR image URIs for pre-built SageMaker Docker images
[ ]:
! pip install sagemaker-experiments
[ ]:
import sagemaker
import json
import pandas as pd
import glob
import s3fs
import boto3
from datetime import datetime
import os
[ ]:
sagemaker_session = sagemaker.Session()
s3 = sagemaker_session.boto_session.resource("s3")

region = boto3.Session().region_name
role = sagemaker.get_execution_role()
smclient = boto3.Session().client("sagemaker")
bucket = sagemaker_session.default_bucket()
prefix = "music-streaming"
Download Data and Upload to S3
We ingest the simulated data from the public SageMaker S3 training database. If you want to see how the train, test, and validation datasets are created in detail, look at Build a Customer Churn Model for Music Streaming App Users: Overview and Data Preparation
[ ]:
##### Alternative: copy data from a public S3 bucket to your own bucket
##### data file should include full_data.csv and sample.json
#### cell 5 - 7 is not needed; the processing job before data wrangler screenshots is not needed
!mkdir -p data/raw
s3 = boto3.client("s3")
s3.download_file(
    f"sagemaker-example-files-prod-{region}",
    "datasets/tabular/customer-churn/customer-churn-data-v2.zip",
    "data/raw/customer-churn-data.zip",
)
[ ]:
!unzip -o ./data/raw/customer-churn-data.zip -d ./data
[ ]:
# unzip the partitioned data files into the same folder
!unzip -o data/simu-1.zip -d data/raw
!unzip -o data/simu-2.zip -d data/raw
!unzip -o data/simu-3.zip -d data/raw
!unzip -o data/simu-4.zip -d data/raw
[ ]:
!rm ./data/raw/*.zip
[ ]:
!unzip -o data/sample.zip -d data/raw
[ ]:
!aws s3 cp ./data/raw s3://$bucket/$prefix/data/json/ --recursive
[ ]:
s3_input_train = (
    boto3.Session()
    .resource("s3")
    .Bucket(bucket)
    .Object(os.path.join(prefix, "train/train.csv"))
    .upload_file("data/train_updated.csv")
)
s3_input_validation = (
    boto3.Session()
    .resource("s3")
    .Bucket(bucket)
    .Object(os.path.join(prefix, "validation/validation.csv"))
    .upload_file("data/validation_updated.csv")
)
s3_input_validation = (
    boto3.Session()
    .resource("s3")
    .Bucket(bucket)
    .Object(os.path.join(prefix, "test/test_labeled.csv"))
    .upload_file("data/test_updated.csv")
)
Initialize Model Hyperparameters
[ ]:
hyperparameters = {
    "max_depth": "12",
    "eta": "0.08",
    "gamma": "4",
    "min_child_weight": "7",
    "subsample": "0.7",
    "eval_metric": "auc",
    "objective": "binary:logistic",
    "num_round": "800",
    "early_stopping_rounds": "50",
}
Define SageMaker estimator
[ ]:
%%time
from time import gmtime, strftime

container = sagemaker.image_uris.retrieve(
    "xgboost", region, version="1.0-1", instance_type="ml.m4.xlarge"
)


xgb = sagemaker.estimator.Estimator(
    container,
    role,
    instance_count=1,
    instance_type="ml.m4.xlarge",
    output_path="s3://{}/{}/output".format(bucket, prefix),
    sagemaker_session=sagemaker_session,
)

xgb.set_hyperparameters(**hyperparameters)
[ ]:
from sagemaker.inputs import TrainingInput

content_type = "csv"
train_input = TrainingInput(
    "s3://{}/{}/{}/".format(bucket, prefix, "train"), content_type=content_type
)
validation_input = TrainingInput(
    "s3://{}/{}/{}/".format(bucket, prefix, "validation"), content_type=content_type
)
[ ]:
%%time
xgb.fit(inputs={"train": train_input, "validation": validation_input}, wait=True)
Define SageMaker Experiment and Trial
[ ]:
# custom trial name
experiment_name = "music-streaming-churn-exp-{}".format(datetime.now().strftime("%Y%m%d-%H%M%S"))
trial_name_xgb = "xgboost-{}".format(datetime.now().strftime("%Y%m%d-%H%M%S"))
[ ]:
%%time
from smexperiments import experiment, trial
from sagemaker import analytics

# create experiment if it doesn't exist
try:
    my_experiment = experiment.Experiment.load(experiment_name=experiment_name)
    print(f"Experiment loaded {experiment_name}: SUCCESS")
except Exception as ex:
    if "ResourceNotFound" in str(ex):
        my_experiment = experiment.Experiment.create(experiment_name=experiment_name)
        print(f"Experiment creation {experiment_name}: SUCCESS")

# create the trial if it doesn't exist
try:
    my_trial = trial.Trial.load(trial_name=trial_name_xgb)
    print(f"Trial loaded {trial_name_xgb}: SUCCESS")
except Exception as ex:
    if "ResourceNotFound" in str(ex):
        my_trial = trial.Trial.create(experiment_name=experiment_name, trial_name=trial_name_xgb)
        print(f"Create trial {my_trial.trial_name}: SUCCESSFUL")


xgb.fit(
    inputs={"train": train_input, "validation": validation_input},
    wait=True,
    experiment_config={
        "ExperimentName": my_experiment.experiment_name,
        "TrialName": my_trial.trial_name,
        "TrialComponentDisplayName": "churn-xgboost",
    },
    logs=True,
)

trial_component_analytics = analytics.ExperimentAnalytics(
    experiment_name=my_experiment.experiment_name
)

analytic_table = trial_component_analytics.dataframe()
analytic_table
Hyperparameter Tuning with SageMaker Hyperparameter Tuning Job
Now that you understand how training one model works and how to create a SageMaker experiment, and selected the XGBoost model as the final model, you will need to fine-tune the hyperparameters for the best model performances. For a xgboost model, you can start with defining ranges for the eta, alpha, min_child_weight, and max_depth. You can check the documentation when considering what haperparameter to tune.
Specify the Hyperparameter Tuning Job Settings
To specify settings for the hyperparameter tuning job, you define a JSON object. You pass the object as the value of the HyperParameterTuningJobConfig parameter to CreateHyperParameterTuningJob when you create the tuning job.
[ ]:
tuning_job_config = {
    "ParameterRanges": {
        "CategoricalParameterRanges": [],
        "ContinuousParameterRanges": [
            {"MaxValue": "1", "MinValue": "0", "Name": "eta"},
            {"MaxValue": "2", "MinValue": "0", "Name": "alpha"},
            {"MaxValue": "10", "MinValue": "1", "Name": "min_child_weight"},
        ],
        "IntegerParameterRanges": [{"MaxValue": "10", "MinValue": "1", "Name": "max_depth"}],
    },
    "ResourceLimits": {"MaxNumberOfTrainingJobs": 20, "MaxParallelTrainingJobs": 3},
    "Strategy": "Bayesian",
    "TrainingJobEarlyStoppingType": "Auto",
    "HyperParameterTuningJobObjective": {"MetricName": "validation:auc", "Type": "Maximize"},
}
Configure the Training Jobs
To configure the training jobs that the tuning job launches, define a JSON object that you pass as the value of the TrainingJobDefinition parameter of the CreateHyperParameterTuningJob call.
[ ]:
s3_input_train = "s3://{}/{}/train".format(bucket, prefix)
s3_input_validation = "s3://{}/{}/validation".format(bucket, prefix)

training_job_definition = {
    "AlgorithmSpecification": {"TrainingImage": container, "TrainingInputMode": "File"},
    "InputDataConfig": [
        {
            "ChannelName": "train",
            "CompressionType": "None",
            "ContentType": "csv",
            "DataSource": {
                "S3DataSource": {
                    "S3DataDistributionType": "FullyReplicated",
                    "S3DataType": "S3Prefix",
                    "S3Uri": s3_input_train,
                }
            },
        },
        {
            "ChannelName": "validation",
            "CompressionType": "None",
            "ContentType": "csv",
            "DataSource": {
                "S3DataSource": {
                    "S3DataDistributionType": "FullyReplicated",
                    "S3DataType": "S3Prefix",
                    "S3Uri": s3_input_validation,
                }
            },
        },
    ],
    "OutputDataConfig": {"S3OutputPath": "s3://{}/{}/output".format(bucket, prefix)},
    "ResourceConfig": {"InstanceCount": 2, "InstanceType": "ml.c4.2xlarge", "VolumeSizeInGB": 10},
    "RoleArn": role,
    "StaticHyperParameters": {
        "eval_metric": "auc",
        "num_round": "100",
        "objective": "binary:logistic",
        "rate_drop": "0.3",
        "tweedie_variance_power": "1.4",
    },
    "StoppingCondition": {"MaxRuntimeInSeconds": 43200},
}
Name and Launch the Hyperparameter Tuning Job
Now you can provide a name for the hyperparameter tuning job and then launch it by calling the CreateHyperParameterTuningJob API. Pass tuning_job_config, and training_job_definition that you created in previous steps as the values of the parameters.
[ ]:
# custom a tuner job name
tuning_job_name = "ChurnPredictTune-{}".format(datetime.now().strftime("%Y%m%d-%H%M%S"))
[ ]:
# check if tuner job has been created
list_tuning_job = smclient.list_hyper_parameter_tuning_jobs(NameContains=tuning_job_name)
job_results = [[i for i in list_tuning_job[x]] for x in list_tuning_job.keys()]
[ ]:
smclient.list_hyper_parameter_tuning_jobs(NameContains=tuning_job_name)
[ ]:
from sagemaker.tuner import HyperparameterTuner

# create the tuning job if it doesn't exist
try:
    if tuning_job_name == job_results[0][0]["HyperParameterTuningJobName"]:
        print(f"Tuning job exists")
except Exception as ex:
    # create hyperparameter tuning job
    smclient.create_hyper_parameter_tuning_job(
        HyperParameterTuningJobName=tuning_job_name,
        HyperParameterTuningJobConfig=tuning_job_config,
        TrainingJobDefinition=training_job_definition,
    )
    print(f"Create tuning job {tuning_job_name}: SUCCESSFUL")
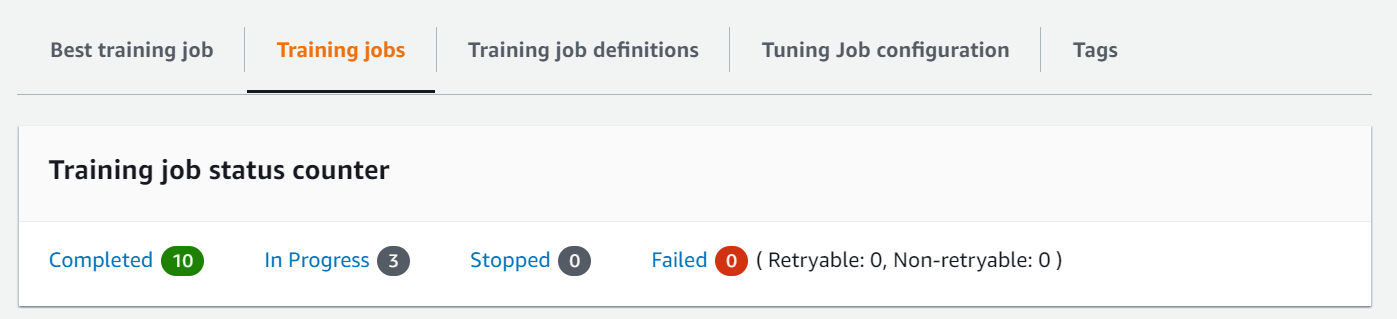
Monitor the Progress of a Hyperparameter Tuning Job
To monitor the progress of a hyperparameter tuning job and the training jobs that it launches, you can use the Amazon SageMaker console.
Deploy the model with SageMaker Batch-transform
You can directly deploy the best model from your hyperparameter tuning job by getting the best training job from your tuner.
[ ]:
%%time
# check status
import time

status = boto3.client("sagemaker").describe_hyper_parameter_tuning_job(
    HyperParameterTuningJobName=tuning_job_name
)["HyperParameterTuningJobStatus"]

while status == "InProgress":
    print(status)
    time.sleep(60)
    status = boto3.client("sagemaker").describe_hyper_parameter_tuning_job(
        HyperParameterTuningJobName=tuning_job_name
    )["HyperParameterTuningJobStatus"]

print(status)
[ ]:
%%time
# Attach to an existing hyperparameter tuning job.
tuning_job_details = smclient.describe_hyper_parameter_tuning_job(
    HyperParameterTuningJobName=tuning_job_name
)
xgb_tuner = HyperparameterTuner.attach(
    tuning_job_name,
    job_details=tuning_job_details,
    sagemaker_session=sagemaker_session,
    estimator_cls=None,
)

# Get the best XGBoost training job name from the HPO job
xgb_best_training_job = xgb_tuner.best_training_job()
print(xgb_best_training_job)
# Attach estimator to the best training job name
best_estimator = sagemaker.estimator.Estimator.attach(xgb_best_training_job)

# Create model to be passed to the inference pipeline
best_model = sagemaker.model.Model(
    model_data=best_estimator.model_data,
    role=sagemaker.get_execution_role(),
    image_uri=best_estimator.image_uri,
)

predictor = best_model.deploy(initial_instance_count=1, instance_type="ml.m5.large")
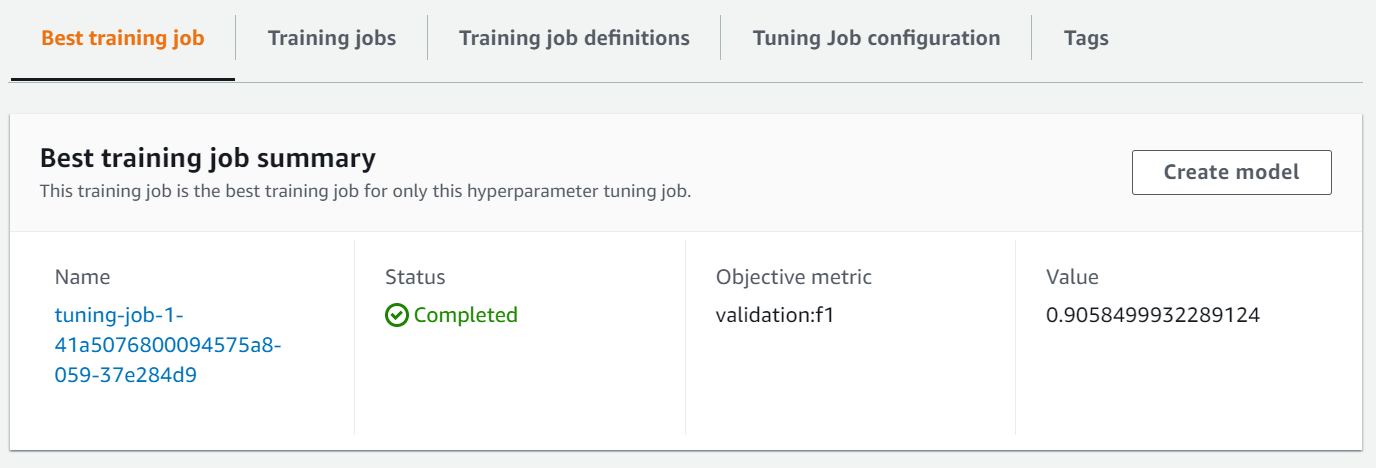
You can also use the following code to find and deploy the best model. Replace with your best model output path. Go to SageMaker Console \(\rightarrow\) Hyperparameter Tuning Job \(\rightarrow\) [Your hyperparameter Tuning Job] \(\rightarrow\) Best model \(\rightarrow\) Output. You can also choose to create a model from the console under best training job.
[ ]:
# replace with your best model output path
# model_artifacts = 's3://{}/{}/output/ChurnPrediction-TuningJob-020-20eee831/output/model.tar.gz'.format(bucket, prefix)
# best_model = sagemaker.model.Model(
#    model_data= model_artifacts,
#    image_uri =container,
#    role=role)
[ ]:
import os

# The location of the test dataset
test_data = pd.read_csv("data/test_w_header.csv")
test_set = test_data.drop(columns=["user_churned"])
test_set.to_csv("data/test.csv", index=False, header=False)
s3_input_validation = (
    boto3.Session()
    .resource("s3")
    .Bucket(bucket)
    .Object(os.path.join(prefix, "test/testdata/test.csv"))
    .upload_file("data/test.csv")
)

batch_input = "s3://{}/{}/test/testdata".format(bucket, prefix)

batch_output = "s3://{}/{}/batch-inference".format(bucket, prefix)
[ ]:
transformer = best_model.transformer(
    instance_count=1, instance_type="ml.m4.xlarge", output_path=batch_output
)
transformer.transform(
    data=batch_input, data_type="S3Prefix", content_type="text/csv", split_type="Line"
)
transformer.wait()
Wait for the previous step to be completed. Once done, you can download the prediction results to your instance for further analysis.
[ ]:
s3.download_file(bucket, prefix + "/batch-inference/test.csv.out", "batch_results")
[ ]:
with open("batch_results") as f:
    results = f.readlines()
Compare model results to actual
You can evaluate your model results with the test data you left out earlier and check the precision and recall. In customer churn problem, precision and recall means:
Precision – Of all the users that the algorithm predicts will churn, how many of them do actually churn?
Recall – What percentage of users that end up churning does the algorithm successfully find?
[ ]:
test_data["predicted_results"] = pd.to_numeric(results)
# define a threshold to convert probability to class, you can set as 0.5 by default
test_data["predicted_binary"] = [1 if x >= 0.5 else 0 for x in test_data["predicted_results"]]
test_data[["user_churned", "predicted_results", "predicted_binary"]]
You did a good job and your model can detect 85% of the users who are going to churn.
[ ]:
from sklearn import metrics

test_labels = test_data["user_churned"]
test_pred = test_data["predicted_binary"]

test_f1 = metrics.f1_score(test_labels, test_pred, average=None)
# fbeta_test= metrics.f1_score(mtest_labels, mpreds_test_xgb, average=None)
prec, rec, fbeta_test, support = metrics.precision_recall_fscore_support(
    test_labels, test_pred, average=None
)
metrics.precision_recall_fscore_support(test_labels, test_pred, average=None)
print("Test Evaluation: ")
print("Average F1 Score: ", (test_f1[0] + test_f1[1]) / 2)
print("Precision Score: ", (prec[1]))
print("Recall Score: ", (rec[1]))
Model Explainability with SageMaker Clarify
You can visualize which feature contributes most to your prediction results by using the new SageMaker feature SageMaker Clarify. It will provide SHAP values which measures the importance of a feature by replacing it with a dummy and seeing how it affects the prediciton. (In reality, SHAP is smart about the choice of dummy and also takes into account feature interactions.) For a more general overview of model interpretability, see this post. For other capabilities of SageMaker Clarify, please see the documentation and the example notebook.
[ ]:
from sagemaker import clarify

clarify_processor = clarify.SageMakerClarifyProcessor(
    role=role, instance_count=1, instance_type="ml.c4.xlarge", sagemaker_session=sagemaker_session
)
[ ]:
from sagemaker.s3 import S3Uploader
from sagemaker.inputs import TrainingInput

train_uri = "s3://{}/{}/train/train.csv".format(bucket, prefix).format(bucket, prefix)
train_input = TrainingInput(train_uri, content_type="csv")
[ ]:
# variables used for parameterizing the notebook run
xgb_endpoint_name = smclient.list_endpoints()["Endpoints"][0]["EndpointName"]
xgb_model_name = smclient.list_models()["Models"][0]["ModelName"]
[ ]:
set(test_data.columns) - set(test_set.columns)
[ ]:
shap_config = clarify.SHAPConfig(
    baseline=[test_set.iloc[0].values.tolist()], num_samples=100, agg_method="mean_abs"
)

explainability_output_path = "s3://{}/{}/clarify-explainability".format(bucket, prefix)

explainability_data_config = clarify.DataConfig(
    s3_data_input_path=train_uri,
    s3_output_path=explainability_output_path,
    label="user_churned",
    headers=test_data.drop(["predicted_results", "predicted_binary"], axis=1).columns.to_list(),
    dataset_type="text/csv",
)

model_config = clarify.ModelConfig(
    model_name=xgb_model_name,
    instance_type="ml.m4.xlarge",
    instance_count=1,
    accept_type="text/csv",
)
[ ]:
clarify_processor.run_explainability(
    data_config=explainability_data_config,
    model_config=model_config,
    explainability_config=shap_config,
)
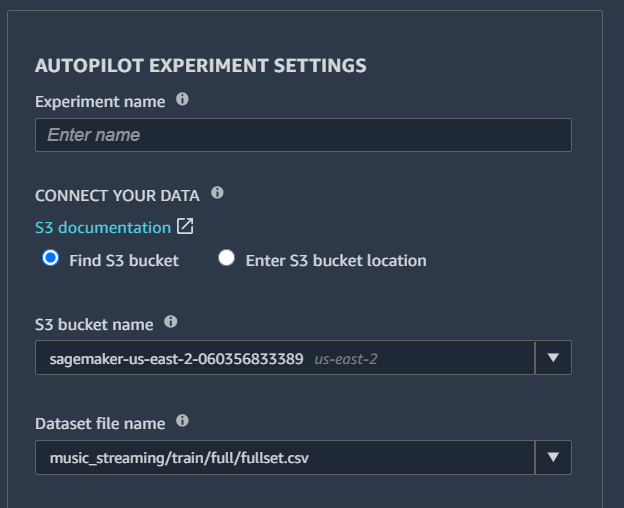
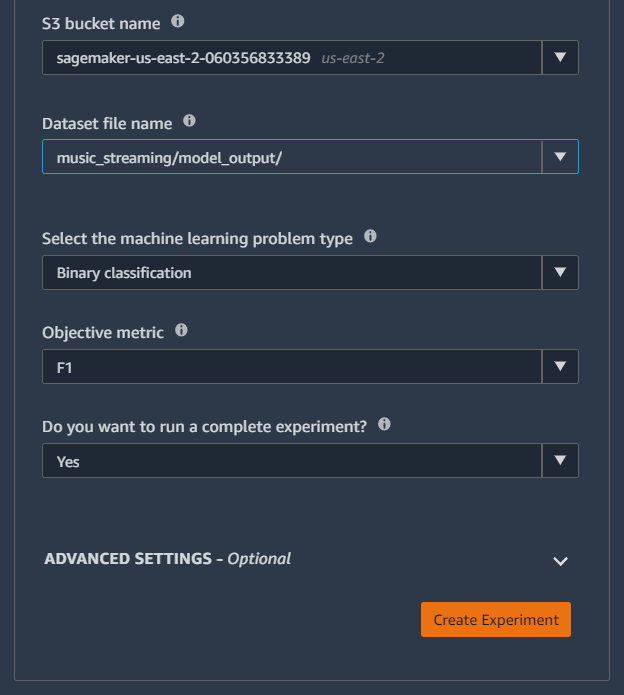
Optional: Automate your training and model selection with SageMaker Autopilot (Console)
With SageMaker Autopilot, you can skip all the steps above and let it automatically tracks the inputs, parameters, configurations, and results of your iterations as trials. Go to SageMaker Experiments List on the left navigation pane, then choose Create Experiment. You will be directed to the experiment creating page. All you need to do is do give the Experiment job a name, specify your input and output data location, specify your target variable, and choose your ML problem type (classification or regression), or leave it as auto.
[ ]:
train_data = pd.read_csv("data/train_w_header.csv")
validation_data = pd.read_csv("data/validation_w_header.csv")

data_for_experiment = pd.concat([train_data, validation_data])
data_for_experiment.to_csv("full_feature_data.csv", index=False)
s3_input_full_set = (
    boto3.Session()
    .resource("s3")
    .Bucket(bucket)
    .Object(os.path.join(prefix, "full/fullset.csv"))
    .upload_file("full_feature_data.csv")
)
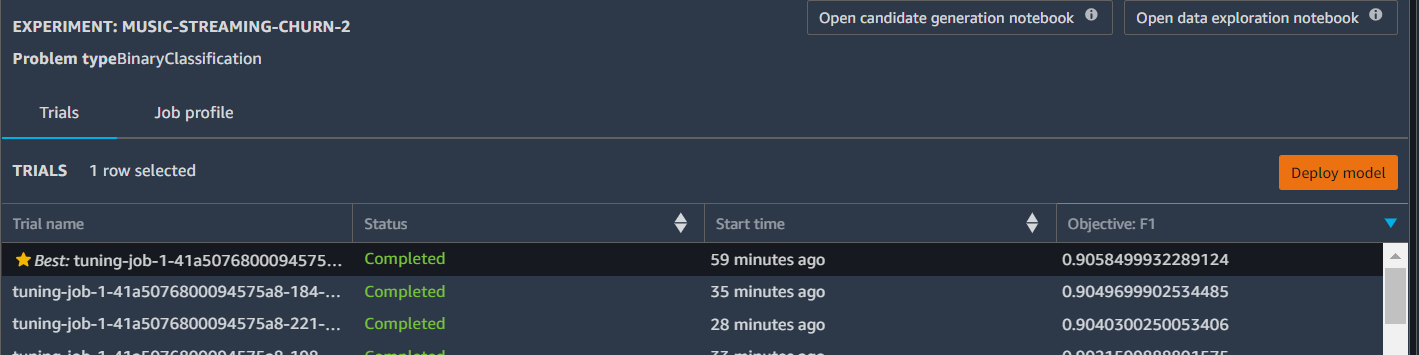
The experiment job will take some time to run (for the default 250 trials). It will go through data exploration, feature engineering, model selection and hyperparameter tuning. It will create a data exploration notebook that describes the data (missing values, numerical feature distributions, etc.), and a candidate generation notebook that describes the AutoML job. At the end of the Experiment job, the best model chosen is highlighted, and you can directly deploy the model for real-time prediction from the SageMaker Experiment Console.
Optional: deploy model created from SageMaker Autopilot
You can navigate to the SageMaker Hyperparameter Tuning Job from the console to find the best model by go to SageMaker :math:`rightarrow` Hyperparameter tuning jobs :math:`rightarrow` <your most recent job name marked as complete> :math:`rightarrow` Best training job then choose Create model.
Alternatively, you can take look at the candidate generation notebook that describes the AutoML job. As part of the job, the input dataset has been randomly split into two pieces, one for training and one for validation. The notebook helps you inspect and modify the data transformation approaches proposed by Amazon SageMaker Autopilot. You can interactively train the data transformation models and use them to transform the data. Finally, you can execute a multiple algorithm hyperparameter optimization (multi-algo HPO) job that helps you find the best model for your dataset by jointly optimizing the data transformations and machine learning algorithms. Note that with the data transformation pipeline created by the AutoML job, the final model may contain more features than what you already created in this notebook, hence it would be better to test the models created by the AutoML job in the Candidate generation notebook to make sure your test data is also processed by the data transformation pipeline and has all the feature needed.
Disclaimer
The data used in this notebook is synthetic and does not contain real user data. The results (all the names, emails, IP addresses, and browser information) of this simulation are fake.
Citation
The data used in this notebook is simulated using the EventSim.
Notebook CI Test Results
This notebook was tested in multiple regions. The test results are as follows, except for us-west-2 which is shown at the top of the notebook.