Data Wrangler Data Prep Widget - Example Notebook
This notebook’s CI test result for us-west-2 is as follows. CI test results in other regions can be found at the end of the notebook.
The Data Wrangler data prep widget automatically generates key visualizations on top of a Pandas data frame to understand data distribution, detect data quality issues, and surface data insights such as outliers for each feature. It helps interact with the data and discover insights that may go unnoticed with ad hoc querying. It also recommends transformations to remediate, enables you to apply data transformations on the UI and automatically generate code in the notebook cells.
By import sagemaker_datawrangler we are enabling the interactive data preparation assistant widget for Pandas dataframe in Amazon SageMaker Studio Notebooks
[ ]:
import pandas as pd
import boto3
import io
import sagemaker_datawrangler
For our use case, we use modified version of the Titanic dataset, a popular dataset in the ML community so you can get started with SageMaker Data Wrangler quickly. The original dataset was obtained from OpenML, and modified to add synthetic data quality issues by Amazon for this demo. You can download the
modified version of dataset from public S3 path s3://sagemaker-example-files-prod-{region}/datasets/tabular/dirty-titanic/titanic-dirty-4.csv
Read the dataset with pandas
[ ]:
s3 = boto3.client("s3")
obj = s3.get_object(
    Bucket=f"sagemaker-example-files-prod-{boto3.session.Session().region_name}",
    Key="datasets/tabular/dirty-titanic/titanic-dirty-4.csv",
)
df = pd.read_csv(io.BytesIO(obj["Body"].read()))
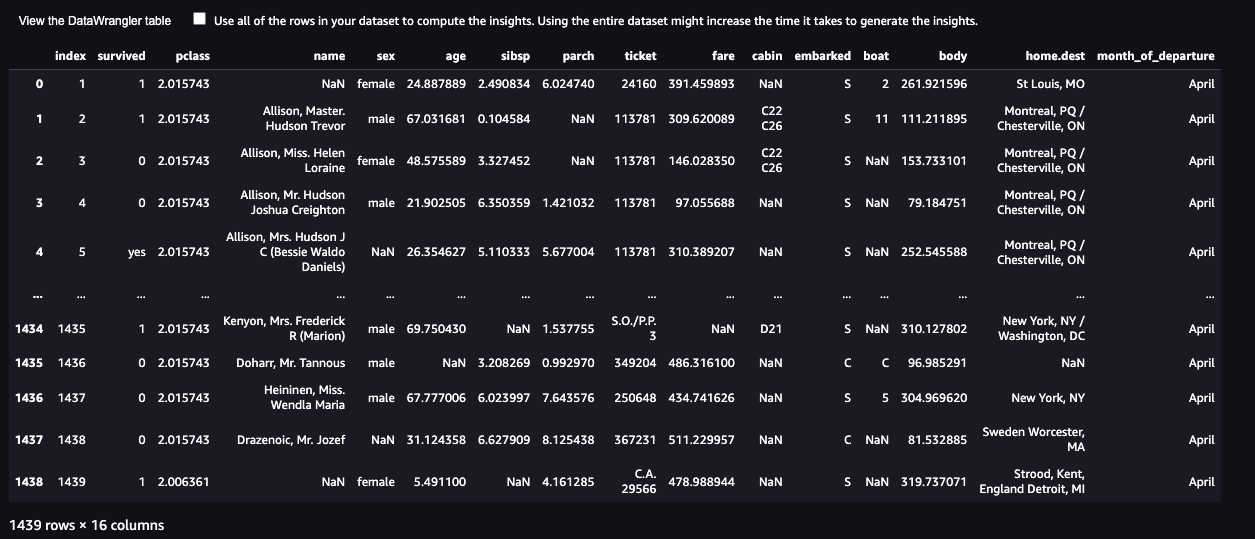
After the data is loaded in the Pandas data frame, you can view the data by just using df or display(df). Along with listing the row, the data prep widget produces insights, visualizations, and advice on data quality. You don’t need to write any additional code to generate feature and target insights, distribution information, or rendering data quality checks. You can choose the data frame table’s header to view the statistical summary showing the data quality warnings, if any.
[ ]:
df
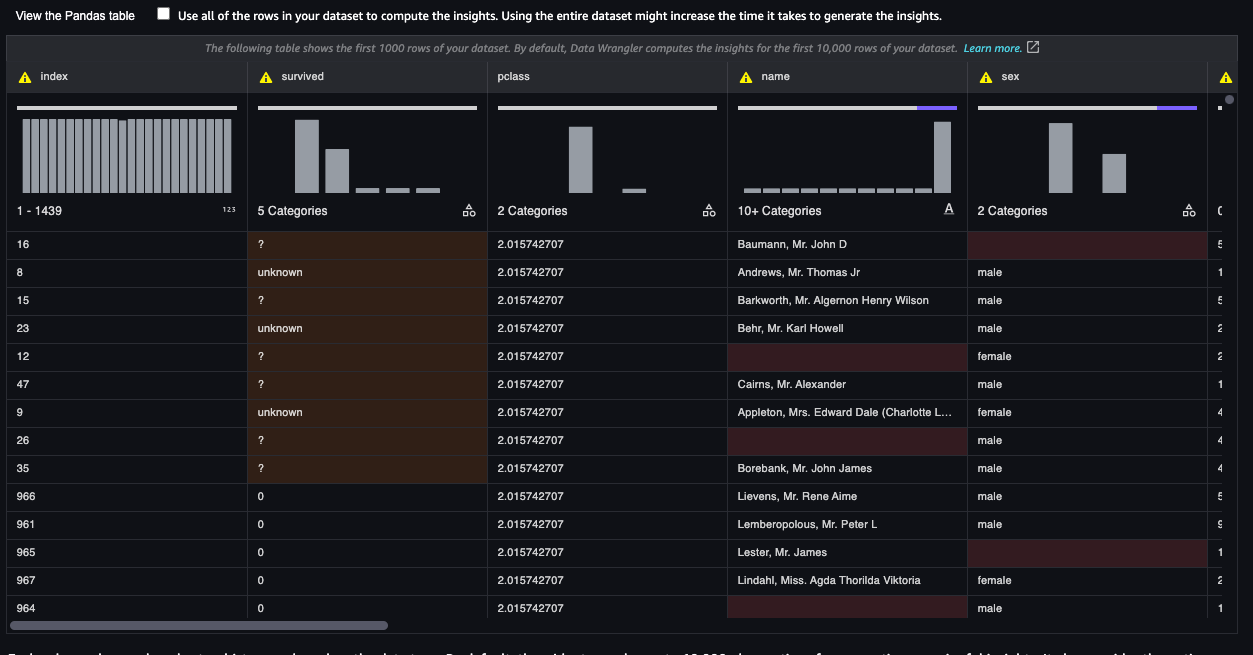
Each column shows a bar chart or histogram based on the data type. By default, the widget samples up to 10,000 observations for generating meaningful insights. It also provides the option to run the insight analysis on the entire dataset.
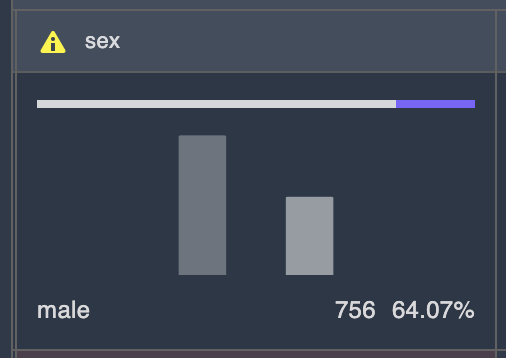
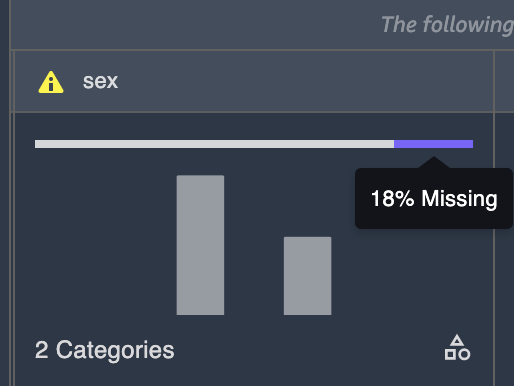
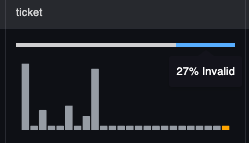
For categorical data, the widget generates the bar chart with all the categories. In the following screenshot, for example, the column “sex” identifies the categories on the data. You can hover over the bar (male in this case) to see the details of these categories, like the total number of rows with the value male and its distribution in the total visualized dataset (64.07% in this example). It also highlights the total percentage of missing values in a different color for categorical data. For quantitative data like the “ticket” column, it shows distribution along with the percentage of invalid values.
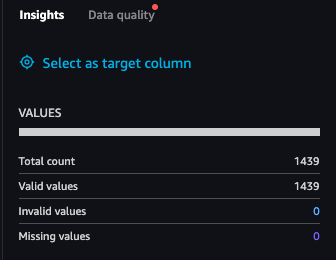
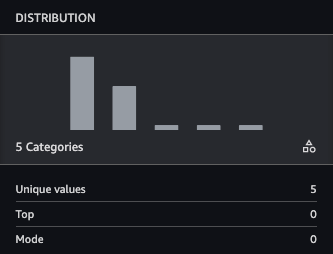
The Insights tab provides details with descriptions for each column. This section lists aggregated statistics, such as mode, number of uniques, ratios and counts for missing/invalid values, etc., as well as visualize data distribution with help of a histogram or a bar chart. In the following screenshots, you can check out the data insights and distribution information displayed with easily understandable visualizations generated for the selected column “survived”
The studio data prep widget highlights identified data quality issues with the warning sign in the header. Widget can identify the whole spectrum of data quality issues from basics (missing values, constant column, etc.) to more ML specific (target leakage, low predictive score features, etc.). Widget highlights the cells causing the data quality issue and reorganize the rows to put the problematic cells at the top. To remedy the data quality issue widget provides several transformers, applicable on a click of a button.
To explore the data quality section, choose the column header, and in the side panel, choose the Data quality tab. You should see the following in your Studio environment.
Let’s look at the different options available on the Data quality tab. For this example, we choose the age column, which is detected as a quantitative column based on the data. As we can see in the following screenshot, this widget suggests different type of transformations that you could apply, including the most common actions, such as Replace with new value, Drop missing, Replace with median, or Replace with mean. You can choose any of those for your dataset based on the use case (the ML problem you’re trying to solve). It also gives you the Drop column option if you want to remove the feature altogether.
When you choose Apply and export code, the transform is applied to the deep copy of the data frame. After the transform is applied successfully, the data table is refreshed with the insights and visualizations. The transform code is generated after the existing cell in the notebook. You can run this exported code later on to apply the transformation on your datasets, and extend it as per your needs. You can customize the transformation by directly modifying the generated code. If we apply the Drop missing option in the Age column, the following transformation code is applied to the dataset, and code is also generated in a cell below the widget:
[ ]:
# Pandas code generated by sagemaker_datawrangler
output_df = df.copy(deep=True)

# Code to Drop missing for column: age to resolve warning: Missing values
output_df = output_df[output_df["age"].notnull()]
The following is generated code for example of a code snippet for Replace with new value:
[ ]:
# Pandas code generated by sagemaker_datawrangler
output_df = df.copy(deep=True)


# Code to Replace with new value for column: age to resolve warning: Missing values
generic_value = 0
output_df["age"] = output_df["age"].fillna(generic_value)
The following is another example of a code snippet for Replace with median:
[ ]:
# Pandas code generated by sagemaker_datawrangler
output_df = df.copy(deep=True)

# Code to Replace with median for column: age to resolve warning: Missing values
output_df["age"] = output_df["age"].fillna(output_df["age"].median(skipna=True))
You can view the results of the applied transform directly on the table. The widget automatically generates Pandas or PySpark code in the Notebook on a new cell.
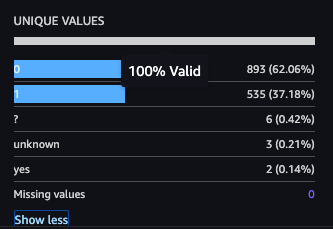
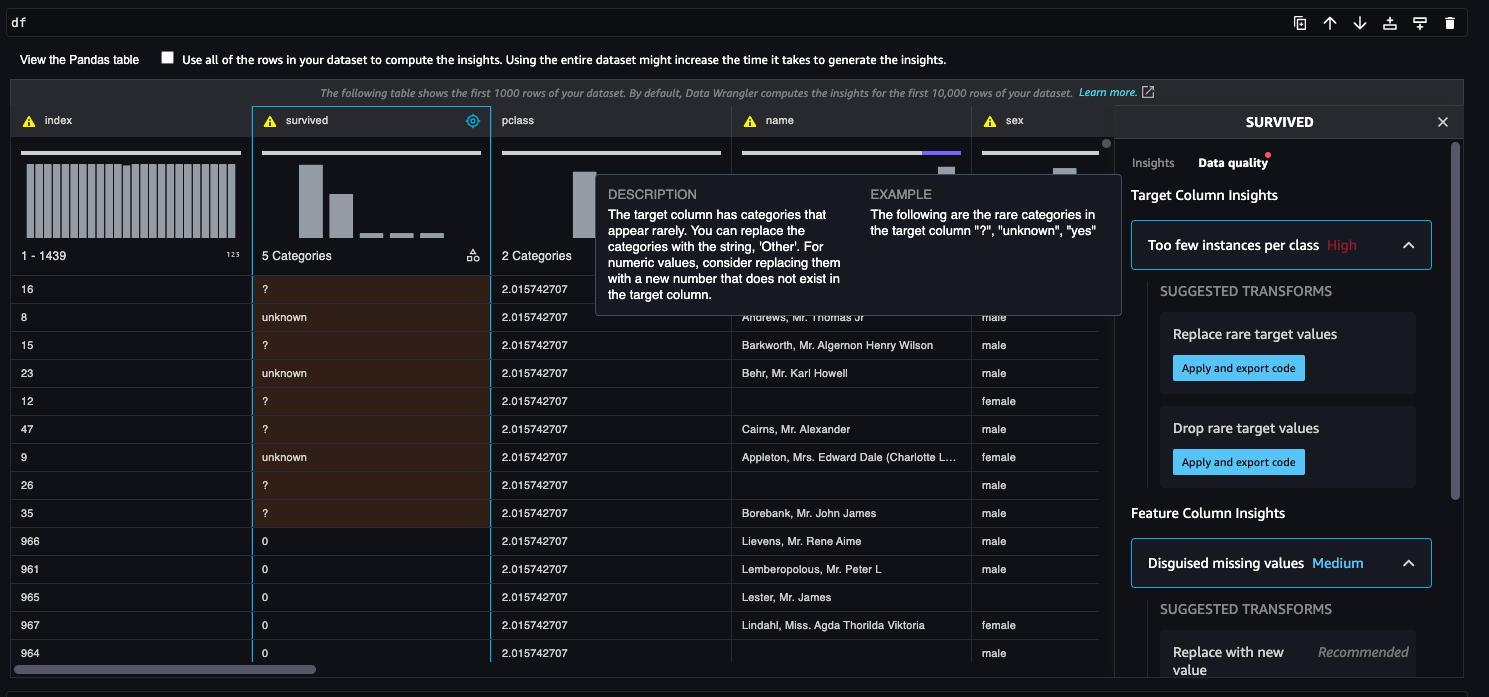
Now let’s look at the data prep widget’s target insight capability. Assume you want to use the survived feature to predict if a passenger will survive. Choose the survived column header. In the side panel, choose Select as target column. The ideal data distribution for the survived feature should have only two classes: yes (1) or no (0), which helps classify the Titanic crash survival chances. However, due to data inconsistencies in the chosen target column, the survived feature has 0, 1, ?, unknown, and yes.
The data prep widget lists the target column insights with recommendations and sample explanations to solve the issues with the target column data quality. It also automatically highlights the anomalous data in the column.
We choose the recommended transform Drop rare target values, because there are fewer observations for the rare target values.
[ ]:
# Pandas code generated by sagemaker_datawrangler
output_df = df.copy(deep=True)

# Code to Drop rare target values for column: survived to resolve warning: Too few instances per class
rare_target_labels_to_drop = ["?", "unknown", "yes"]
output_df = output_df[~output_df["survived"].isin(rare_target_labels_to_drop)]
If you want to see a standard pandas visualization in the notebook, you can choose View the Pandas table and toggle between the widget and the Pandas representation, as shown in the following screenshot.
[ ]:
df
Notebook CI Test Results
This notebook was tested in multiple regions. The test results are as follows, except for us-west-2 which is shown at the top of the notebook.