Amazon SageMaker Model Quality Monitor
This notebook’s CI test result for us-west-2 is as follows. CI test results in other regions can be found at the end of the notebook.
Host a trained machine learning model in Amazon SageMaker. Monitor and detect machine learning model quality drift
This notebook shows how to: * Host a machine learning model in Amazon SageMaker and capture inference requests, results, and metadata * Generate a baseline of model quality and suggested constraints * Monitor a live endpoint for violations against the suggested constraints * Generate CloudWatch Alarms on model quality drift
Table of Contents
Section 2 - Deploy pre-trained model with data capture enabled
Section 4 - Setup continuous model monitoring to identify model quality drift
Introduction
Amazon SageMaker provides every developer and data scientist with the ability to build, train, and deploy machine learning (ML) models quickly by bringing together a broad set of capabilities purpose-built for ML. Amazon SageMaker is a fully-managed service that encompasses the entire ML workflow. You can label and prepare your data, choose an algorithm, train a model, and then tune and optimize it for deployment. You can deploy your models to production with Amazon SageMaker to make predictions and lower costs than it was previously possible.
Amazon SageMaker Model Monitor allows you to maintain high quality ML models by automatically detecting and helping you remediate inaccuracies in model predictions. Model Monitor helps you detect changes in properties of independent variables to help maintain data quality, and monitors model performance characteristics such as accuracy and precision in real-time to help maintain model quality.
In this notebook, you learn how to use Amazon SageMaker model quality monitoring capability to monitor model performance characteristics of your in-production ML models. You will learn how to configure Amazon CloudWatch alerts to get notified if the model quality degrades from the configured baseline quality.
Section 1 - Setup
In this section, you will import the necessary libraries, setup variables and examine data that was used to train the XGBoost customer churn model provided with this notebook.
Let’s start by specifying:
The AWS region used to host your model.
The IAM role associated with this SageMaker notebook instance.
The S3 bucket used to store the data used to train your model, any additional model data, and the data captured from model invocations.
1.1 Import necessary libraries
[ ]:
%%time

from datetime import datetime, timedelta, timezone
import json
import os
import re
import boto3
from time import sleep
from threading import Thread

import pandas as pd

from sagemaker import get_execution_role, session, Session, image_uris
from sagemaker.s3 import S3Downloader, S3Uploader
from sagemaker.processing import ProcessingJob
from sagemaker.serializers import CSVSerializer

from sagemaker.model import Model
from sagemaker.model_monitor import DataCaptureConfig

session = Session()
1.2 AWS region and IAM Role
[ ]:
# Get Execution role
role = get_execution_role()
print("RoleArn:", role)

region = session.boto_region_name
print("Region:", region)
1.3 S3 bucket and prefixes
[ ]:
# Setup S3 bucket
# You can use a different bucket, but make sure the role you chose for this notebook
# has the s3:PutObject permissions. This is the bucket into which the data is captured
bucket = session.default_bucket()
print("Demo Bucket:", bucket)
prefix = "sagemaker/Churn-ModelQualityMonitor-20201201"

##S3 prefixes
data_capture_prefix = f"{prefix}/datacapture"
s3_capture_upload_path = f"s3://{bucket}/{data_capture_prefix}"

ground_truth_upload_path = (
    f"s3://{bucket}/{prefix}/ground_truth_data/{datetime.now():%Y-%m-%d-%H-%M-%S}"
)

reports_prefix = f"{prefix}/reports"
s3_report_path = f"s3://{bucket}/{reports_prefix}"

##Get the model monitor image
monitor_image_uri = image_uris.retrieve(framework="model-monitor", region=region)

print("Image URI:", monitor_image_uri)
print(f"Capture path: {s3_capture_upload_path}")
print(f"Ground truth path: {ground_truth_upload_path}")
print(f"Report path: {s3_report_path}")
1.4 Test access to the S3 bucket
Let’s quickly verify that the notebook has the right permissions to access the S3 bucket specified above. Upload a simple test object into the S3 bucket. If this command fails, the data capture and model monitoring capabilities will not work from this notebook. You can fix this by updating the role associated with this notebook instance to have “s3:PutObject” permissions and try this validation again
[ ]:
# Upload some test files
S3Uploader.upload("test_data/upload-test-file.txt", f"s3://{bucket}/test_upload")
print("Success! You are all set to proceed.")
Section 2 - Deploy pre-trained model with data capture enabled
In this section, you will upload the pretrained model to the S3 bucket, create an Amazon SageMaker Model, create an Amazon SageMaker real time endpoint, and enable data capture on the endpoint to capture endpoint invocations, predictions, and metadata.
2.1 Upload the pre-trained model to S3
This code uploads a pre-trained XGBoost model that is ready for you to deploy. This model was trained using the XGB Churn Prediction Notebook in SageMaker. You can also use your own pre-trained model in this step. If you already have a pretrained model in Amazon S3, you can add it instead by specifying the s3_key.
[ ]:
##Upload the pretrained model to S3
s3_key = f"s3://{bucket}/{prefix}"
model_url = S3Uploader.upload("model/xgb-churn-prediction-model.tar.gz", s3_key)
model_url
2.2 Create SageMaker Model entity
This step creates an Amazon SageMaker model from the model file uploaded to S3.
[ ]:
model_name = f"DEMO-xgb-churn-pred-model-monitor-{datetime.utcnow():%Y-%m-%d-%H%M}"

image_uri = image_uris.retrieve(framework="xgboost", version="0.90-1", region=region)

model = Model(image_uri=image_uri, model_data=model_url, role=role, sagemaker_session=session)
2.3 Deploy the model with data capture enabled.
Next, deploy the SageMaker model on a specific instance with data capture enabled.
[ ]:
endpoint_name = f"DEMO-xgb-churn-model-quality-monitor-{datetime.utcnow():%Y-%m-%d-%H%M}"
print("EndpointName =", endpoint_name)

data_capture_config = DataCaptureConfig(
    enable_capture=True, sampling_percentage=100, destination_s3_uri=s3_capture_upload_path
)

model.deploy(
    initial_instance_count=1,
    instance_type="ml.m4.xlarge",
    endpoint_name=endpoint_name,
    data_capture_config=data_capture_config,
)
2.4 Create the SageMaker Predictor object from the endpoint to be used for invoking the model
[ ]:
from sagemaker.predictor import Predictor

predictor = Predictor(
    endpoint_name=endpoint_name, sagemaker_session=session, serializer=CSVSerializer()
)
Section 3 - Generate a baseline for model quality performance
In this section, you will invoke the endpoint created above using validation data. Predictions from the deployed model using this validation data will be used as a baseline dataset. You will then use SageMaker’s Model Monitoring to execute a baseline job that computes model performance data, and suggest model quality constraints based on the baseline dataset.
3.1 Execute predictions using the validation dataset.
The deployed model returns probability that a customer will churn. Let’s choose an arbitrary 0.8 cutoff to consider that a customer will churn.
[ ]:
churn_cutoff = 0.8
validate_dataset = "validation_with_predictions.csv"
[ ]:
limit = 200  # Need at least 200 samples to compute standard deviations
i = 0
with open(f"test_data/{validate_dataset}", "w") as baseline_file:
    baseline_file.write("probability,prediction,label\n")  # our header
    with open("test_data/validation.csv", "r") as f:
        for row in f:
            (label, input_cols) = row.split(",", 1)
            probability = float(predictor.predict(input_cols))
            prediction = "1" if probability > churn_cutoff else "0"
            baseline_file.write(f"{probability},{prediction},{label}\n")
            i += 1
            if i > limit:
                break
            print(".", end="", flush=True)
            sleep(0.5)
print()
print("Done!")
3.2 Examine the predictions from the model
[ ]:
!head test_data/validation_with_predictions.csv
3.3 Upload the predictions as a baseline dataset.
Now we will upload the predictions made using validation dataset to S3 which will be used for creating model quality baseline statistics and constraints
[ ]:
baseline_prefix = prefix + "/baselining"
baseline_data_prefix = baseline_prefix + "/data"
baseline_results_prefix = baseline_prefix + "/results"

baseline_data_uri = f"s3://{bucket}/{baseline_data_prefix}"
baseline_results_uri = f"s3://{bucket}/{baseline_results_prefix}"
print(f"Baseline data uri: {baseline_data_uri}")
print(f"Baseline results uri: {baseline_results_uri}")
[ ]:
baseline_dataset_uri = S3Uploader.upload(f"test_data/{validate_dataset}", baseline_data_uri)
baseline_dataset_uri
3.4 Create a baselining job with validation dataset predictions
Define the model quality monitoring object and execute the model quality monitoring baseline job. Model monitor will automatically generate baseline statistics and constraints based on the validation dataset provided.
[ ]:
from sagemaker.model_monitor import ModelQualityMonitor
from sagemaker.model_monitor import EndpointInput
from sagemaker.model_monitor.dataset_format import DatasetFormat
[ ]:
# Create the model quality monitoring object
churn_model_quality_monitor = ModelQualityMonitor(
    role=role,
    instance_count=1,
    instance_type="ml.m5.xlarge",
    volume_size_in_gb=20,
    max_runtime_in_seconds=1800,
    sagemaker_session=session,
)
[ ]:
# Name of the model quality baseline job
baseline_job_name = f"DEMO-xgb-churn-model-baseline-job-{datetime.utcnow():%Y-%m-%d-%H%M}"
[ ]:
# Execute the baseline suggestion job.
# You will specify problem type, in this case Binary Classification, and provide other required attributes.
job = churn_model_quality_monitor.suggest_baseline(
    job_name=baseline_job_name,
    baseline_dataset=baseline_dataset_uri,
    dataset_format=DatasetFormat.csv(header=True),
    output_s3_uri=baseline_results_uri,
    problem_type="BinaryClassification",
    inference_attribute="prediction",
    probability_attribute="probability",
    ground_truth_attribute="label",
)
job.wait(logs=False)
3.5 Explore the results of the baselining job
You could see the baseline constraints and statistics files are uploaded to the S3 location.
[ ]:
baseline_job = churn_model_quality_monitor.latest_baselining_job
You could see that the baseline statistics and constraints files are already uploaded to S3.
[ ]:
binary_metrics = baseline_job.baseline_statistics().body_dict["binary_classification_metrics"]
pd.json_normalize(binary_metrics).T
[ ]:
pd.DataFrame(baseline_job.suggested_constraints().body_dict["binary_classification_constraints"]).T
In the above example you can see that model quality monitor suggested a constraint that will ensure that the model F2 score should note drop below 0.625. Few generated constraints may be a tad aggressive like precision, where it will alert on any drops below 1.0. It is recommended to modify this file as necessary prior to using for monitoring.
Section 4 - Setup continuous model monitoring to identify model quality drift
In this section, you will setup a continuous model monitoring job that monitors the quality of the deployed model against the baseline generated in the previous section. This is to ensure that the quality does not degrade over time.
In addition to the generated baseline, Amazon SageMaker Model Quality Monitoring needs two additional inputs - predictions made by the deployed model endpoint and the ground truth data to be provided by the model consuming application. Since you already enabled data capture on the endpoint, prediction data is captured in S3. The ground truth data depends on the what your model is predicting and what the business use case is. In this case, since the model is predicting customer churn, ground truth data may indicate if the customer actually left the company or not. For the purposes of this notebook, you will generate synthetic data as ground truth.
4.1 Generate prediction data for Model Quality Monitoring
Start generating some artificial traffic. The cell below starts a thread to send some traffic to the endpoint. Note that you need to stop the kernel to terminate this thread. If there is no traffic, the monitoring jobs are marked as Failed since there is no data to process.
[ ]:
def invoke_endpoint(ep_name, file_name):
    with open(file_name, "r") as f:
        i = 0
        for row in f:
            payload = row.rstrip("\n")
            response = session.sagemaker_runtime_client.invoke_endpoint(
                EndpointName=endpoint_name,
                ContentType="text/csv",
                Body=payload,
                InferenceId=str(i),  # unique ID per row
            )["Body"].read()
            i += 1
            sleep(1)


def invoke_endpoint_forever():
    while True:
        try:
            invoke_endpoint(endpoint_name, "test_data/test-dataset-input-cols.csv")
        except session.sagemaker_runtime_client.exceptions.ValidationError:
            pass


thread = Thread(target=invoke_endpoint_forever)
thread.start()
Notice the new attribute inferenceId, which we’re setting when invoking the endpoint. This is used to join the prediction data with the ground truth data.
4.2 View captured data
Now list the data capture files stored in Amazon S3. You should expect to see different files from different time periods organized based on the hour in which the invocation occurred. The format of the Amazon S3 path is:
s3://{destination-bucket-prefix}/{endpoint-name}/{variant-name}/yyyy/mm/dd/hh/filename.jsonl
[ ]:
print("Waiting for captures to show up", end="")
for _ in range(120):
    capture_files = sorted(S3Downloader.list(f"{s3_capture_upload_path}/{endpoint_name}"))
    if capture_files:
        capture_file = S3Downloader.read_file(capture_files[-1]).split("\n")
        capture_record = json.loads(capture_file[0])
        if "inferenceId" in capture_record["eventMetadata"]:
            break
    print(".", end="", flush=True)
    sleep(1)
print()
print("Found Capture Files:")
print("\n ".join(capture_files[-3:]))
Next, view the contents of a single capture file. Here you should see all the data captured in an Amazon SageMaker specific JSON-line formatted file. Take a quick peek at the first few lines in the captured file.
[ ]:
print("\n".join(capture_file[-3:-1]))
Finally, the contents of a single line is present below in a formatted JSON file so that you can observe a little better.
Again, notice the inferenceId attribute that is set as part of the invoke_endpoint call. If this is present, it will be used to join with ground truth data (otherwise eventId will be used):
[ ]:
print(json.dumps(capture_record, indent=2))
4.3 Generate synthetic ground truth
Next, start generating ground truth data. The model quality job will fail if there’s no ground truth data to merge.
[ ]:
import random


def ground_truth_with_id(inference_id):
    random.seed(inference_id)  # to get consistent results
    rand = random.random()
    return {
        "groundTruthData": {
            "data": "1" if rand < 0.7 else "0",  # randomly generate positive labels 70% of the time
            "encoding": "CSV",
        },
        "eventMetadata": {
            "eventId": str(inference_id),
        },
        "eventVersion": "0",
    }


def upload_ground_truth(records, upload_time):
    fake_records = [json.dumps(r) for r in records]
    data_to_upload = "\n".join(fake_records)
    target_s3_uri = f"{ground_truth_upload_path}/{upload_time:%Y/%m/%d/%H/%M%S}.jsonl"
    print(f"Uploading {len(fake_records)} records to", target_s3_uri)
    S3Uploader.upload_string_as_file_body(data_to_upload, target_s3_uri)
[ ]:
NUM_GROUND_TRUTH_RECORDS = 334  # 334 are the number of rows in data we're sending for inference


def generate_fake_ground_truth_forever():
    j = 0
    while True:
        fake_records = [ground_truth_with_id(i) for i in range(NUM_GROUND_TRUTH_RECORDS)]
        upload_ground_truth(fake_records, datetime.utcnow())
        j = (j + 1) % 5
        sleep(60 * 60)  # do this once an hour


gt_thread = Thread(target=generate_fake_ground_truth_forever)
gt_thread.start()
4.4 Create a monitoring schedule
Now that you have the baseline information and ground truth labels, create a monitoring schedule to run model quality monitoring job.
[ ]:
##Monitoring schedule name
churn_monitor_schedule_name = (
    f"DEMO-xgb-churn-monitoring-schedule-{datetime.utcnow():%Y-%m-%d-%H%M}"
)
For the monitoring schedule you need to specify how to interpret an endpoint’s output. Given that the endpoint in this notebook outputs CSV data, the below code specifies that the first column of the output, 0, contains a probability (of churn in this example). You will further specify 0.5 as the cutoff used to determine a positive label (that is, predict that a customer will churn).
[ ]:
# Create an enpointInput
endpointInput = EndpointInput(
    endpoint_name=predictor.endpoint_name,
    probability_attribute="0",
    probability_threshold_attribute=0.5,
    destination="/opt/ml/processing/input_data",
)
[ ]:
# Create the monitoring schedule to execute every hour.
from sagemaker.model_monitor import CronExpressionGenerator

response = churn_model_quality_monitor.create_monitoring_schedule(
    monitor_schedule_name=churn_monitor_schedule_name,
    endpoint_input=endpointInput,
    output_s3_uri=baseline_results_uri,
    problem_type="BinaryClassification",
    ground_truth_input=ground_truth_upload_path,
    constraints=baseline_job.suggested_constraints(),
    schedule_cron_expression=CronExpressionGenerator.hourly(),
    enable_cloudwatch_metrics=True,
)
[ ]:
# Create the monitoring schedule
# You will see the monitoring schedule in the 'Scheduled' status
churn_model_quality_monitor.describe_schedule()
4.5 Examine monitoring schedule executions
[ ]:
# Initially there will be no executions since the first execution happens at the top of the hour
# Note that it is common for the execution to luanch upto 20 min after the hour.
executions = churn_model_quality_monitor.list_executions()
executions
[ ]:
# Wait for the first execution of the monitoring_schedule
print("Waiting for first execution", end="")
while True:
    execution = churn_model_quality_monitor.describe_schedule().get(
        "LastMonitoringExecutionSummary"
    )
    if execution:
        break
    print(".", end="", flush=True)
    sleep(10)
print()
print("Execution found!")
[ ]:
while not executions:
    executions = churn_model_quality_monitor.list_executions()
    sleep(10)
latest_execution = executions[-1]
latest_execution.describe()
In the previous cell, you picked up the latest completed or failed scheduled execution. Here are the possible terminal states and what each of them mean: * Completed - This means the monitoring execution completed and no issues were found in the violations report. * CompletedWithViolations - This means the execution completed, but constraint violations were detected. * Failed - The monitoring execution failed, maybe due to client error (perhaps incorrect role permissions) or infrastructure issues. Further examination of FailureReason and ExitMessage is necessary to identify what exactly happened. * Stopped - job exceeded max runtime or was manually stopped.
[ ]:
status = execution["MonitoringExecutionStatus"]

while status in ["Pending", "InProgress"]:
    print("Waiting for execution to finish", end="")
    latest_execution.wait(logs=False)
    latest_job = latest_execution.describe()
    print()
    print(f"{latest_job['ProcessingJobName']} job status:", latest_job["ProcessingJobStatus"])
    print(
        f"{latest_job['ProcessingJobName']} job exit message, if any:",
        latest_job.get("ExitMessage"),
    )
    print(
        f"{latest_job['ProcessingJobName']} job failure reason, if any:",
        latest_job.get("FailureReason"),
    )
    sleep(
        30
    )  # model quality executions consist of two Processing jobs, wait for second job to start
    latest_execution = churn_model_quality_monitor.list_executions()[-1]
    execution = churn_model_quality_monitor.describe_schedule()["LastMonitoringExecutionSummary"]
    status = execution["MonitoringExecutionStatus"]

print("Execution status is:", status)

if status != "Completed":
    print(execution)
    print(
        "====STOP==== \n No completed executions to inspect further. Please wait till an execution completes or investigate previously reported failures."
    )
[ ]:
latest_execution = churn_model_quality_monitor.list_executions()[-1]
report_uri = latest_execution.describe()["ProcessingOutputConfig"]["Outputs"][0]["S3Output"][
    "S3Uri"
]
print("Report Uri:", report_uri)
4.5 View violations generated by monitoring schedule
If there are any violations compared to the baseline, they will be listed in the reports uploaded to S3.
[ ]:
pd.options.display.max_colwidth = None
violations = latest_execution.constraint_violations().body_dict["violations"]
violations_df = pd.json_normalize(violations)
violations_df.head(10)
Here you can see that one of the violations generated is that the f2 score is less than the threshold value set as part of baselining.
Section 5 - Analyze model quality CloudWatch metrics
In addition to the violations, the monitoring schedule also emits CloudWatch metrics. In this section, you will view the metrics generated and setup an CloudWatch alarm to be triggered when the model quality drifts from the baseline thresholds. You could use CloudWatch alarms to trigger remedial actions such as retraining your model or updating the training dataset.
5.1 List the CW metrics generated.
[ ]:
# Create CloudWatch client
cw_client = boto3.Session().client("cloudwatch")

namespace = "aws/sagemaker/Endpoints/model-metrics"

cw_dimensions = [
    {"Name": "Endpoint", "Value": endpoint_name},
    {"Name": "MonitoringSchedule", "Value": churn_monitor_schedule_name},
]
[ ]:
# List metrics through the pagination interface
paginator = cw_client.get_paginator("list_metrics")

for response in paginator.paginate(Dimensions=cw_dimensions, Namespace=namespace):
    model_quality_metrics = response["Metrics"]
    for metric in model_quality_metrics:
        print(metric["MetricName"])
5.2 Create a CloudWatch Alarm
Based on the cloud watch metrics, you can create a cloud watch alarm when a specific metric does not meet the threshold configured. Here you will create an alarm if the f2 value of the model fall below the threshold suggested by the baseline constraints.
[ ]:
alarm_name = "MODEL_QUALITY_F2_SCORE"
alarm_desc = (
    "Trigger an CloudWatch alarm when the f2 score drifts away from the baseline constraints"
)
mdoel_quality_f2_drift_threshold = (
    0.625  ##Setting this threshold purposefully low to see the alarm quickly.
)
metric_name = "f2"
namespace = "aws/sagemaker/Endpoints/model-metrics"

cw_client.put_metric_alarm(
    AlarmName=alarm_name,
    AlarmDescription=alarm_desc,
    ActionsEnabled=True,
    MetricName=metric_name,
    Namespace=namespace,
    Statistic="Average",
    Dimensions=[
        {"Name": "Endpoint", "Value": endpoint_name},
        {"Name": "MonitoringSchedule", "Value": churn_monitor_schedule_name},
    ],
    Period=600,
    EvaluationPeriods=1,
    DatapointsToAlarm=1,
    Threshold=mdoel_quality_f2_drift_threshold,
    ComparisonOperator="LessThanOrEqualToThreshold",
    TreatMissingData="breaching",
)
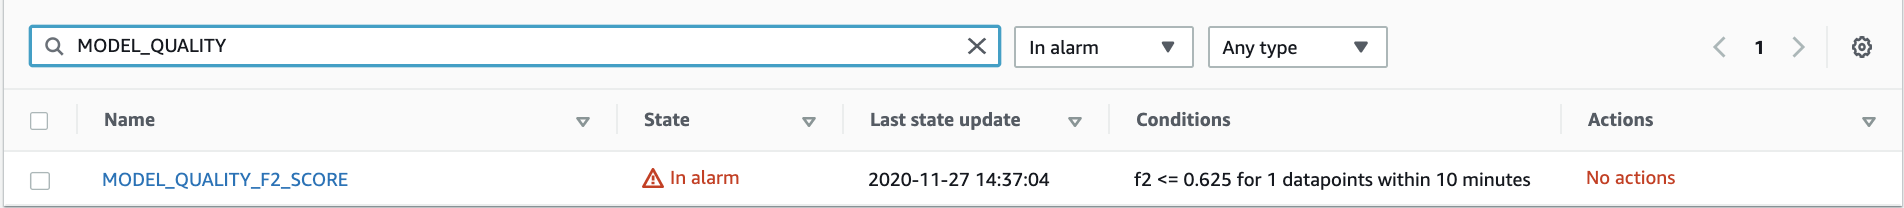
5.3 Validation
In a few minutes, you should see a CloudWatch alarm created. The alarm will first be in “Insufficient Data” state and moves into “Alert” state. This can be verified in the CloudWatch console
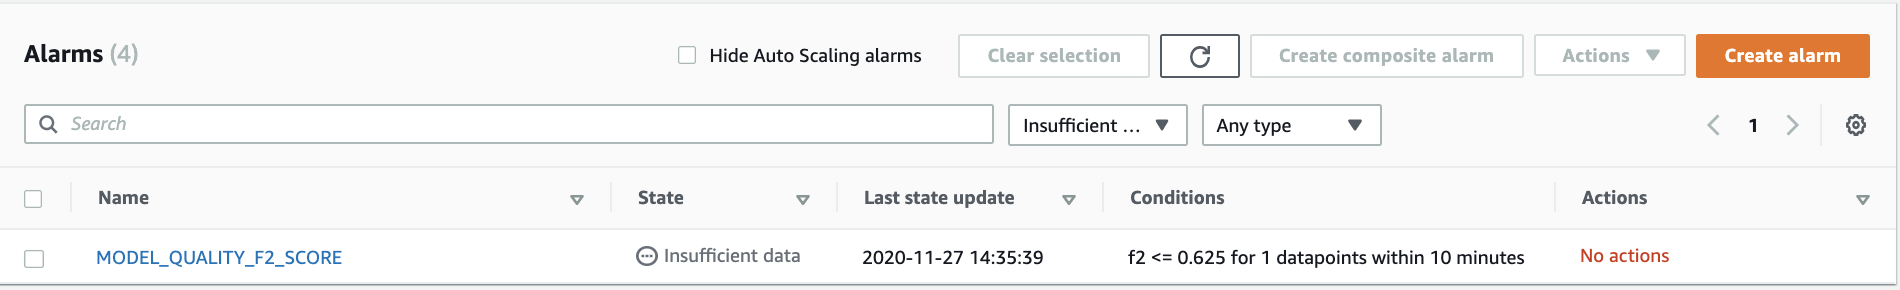
Once the CW Alarm is generated, you can decide on what actions you want to take on these alerts. A possible action could be updating the training data an retraining the model
Clean up
You can keep your endpoint running to continue capturing data. If you do not plan to collect more data or use this endpoint further, you should delete the endpoint to avoid incurring additional charges. Note that deleting your endpoint does not delete the data that was captured during the model invocations. That data persists in Amazon S3 until you delete it yourself.
But before that, you need to delete the schedule first.
[ ]:
churn_model_quality_monitor.delete_monitoring_schedule()
sleep(60)  # actually wait for the deletion
[ ]:
predictor.delete_model()
predictor.delete_endpoint()
Notebook CI Test Results
This notebook was tested in multiple regions. The test results are as follows, except for us-west-2 which is shown at the top of the notebook.