How to identify low GPU utilization due to small batch size
This notebook’s CI test result for us-west-2 is as follows. CI test results in other regions can be found at the end of the notebook.
In this notebook, we demonstrate how the profiling functionality of Amazon SageMaker Debugger can be used to identify under-utilization of the GPU resource, resulting from a low training batch size. We will demonstrate this using TensorFlow, on a ResNet50 model, and the CIFAR-10 dataset. The training script for this example is demo/train_tf_bottleneck.py
1. Prepare training dataset
Tensorflow Datasets package
First of all, set the notebook kernel to Tensorflow 2.x.
We will use CIFAR-10 dataset for this experiment. To download CIFAR-10 datasets and convert it into TFRecord format, run demo/generate_cifar10_tfrecords, and upload tfrecord files to your S3 bucket.
[ ]:
!python demo/generate_cifar10_tfrecords.py --data-dir=./data
[ ]:
import sagemaker

s3_bucket = sagemaker.Session().default_bucket()

dataset_prefix = "data/cifar10-tfrecords"
desired_s3_uri = f"s3://{s3_bucket}/{dataset_prefix}"

dataset_location = sagemaker.s3.S3Uploader.upload(local_path="data", desired_s3_uri=desired_s3_uri)
print(f"Dataset uploaded to {dataset_location}")
2. Create a Training Job with Profiling Enabled
We will use the standard SageMaker Estimator API for Tensorflow to create a training job. To enable profiling, create a ProfilerConfig object and pass it to the profiler_config parameter of the TensorFlow estimator. In this case we set the profiling interval to be 500 miliseconds.
Set a profiler configuration
[ ]:
from sagemaker.debugger import ProfilerConfig, FrameworkProfile

profiler_config = ProfilerConfig(
    system_monitor_interval_millis=500,
    framework_profile_params=FrameworkProfile(
        local_path="/opt/ml/output/profiler/", start_step=5, num_steps=2
    ),
)
Define hyperparameters
The start_up script, train_tf_bottleneck.py, accepts a number of parameters. Here we set the batch_size to 64, and the number of epochs to 3 to keep the training short for testing.
[ ]:
batch_size = 64

hyperparameters = {
    "epoch": 3,
    "batch_size": batch_size,
}
Get the image URI
The image that we will is dependent on the region that you are running this notebook in.
[ ]:
import boto3

session = boto3.session.Session()
region = session.region_name

image_uri = f"763104351884.dkr.ecr.{region}.amazonaws.com/tensorflow-training:2.3.1-gpu-py37-cu110-ubuntu18.04"
Define SageMaker Tensorflow Estimator
To enable profiling, you need to pass the Debugger profiling configuration (profiler_config), a list of Debugger rules (rules), and the image URI (image_uri) to the estimator. Debugger enables monitoring and profiling while the SageMaker estimator requests a training job.
[ ]:
import sagemaker
from sagemaker.tensorflow import TensorFlow

job_name = f"lowbatchsize-{batch_size}"
instance_count = 1
instance_type = "ml.p2.xlarge"
entry_script = "train_tf_bottleneck.py"

estimator = TensorFlow(
    role=sagemaker.get_execution_role(),
    image_uri=image_uri,
    base_job_name=job_name,
    instance_type=instance_type,
    instance_count=instance_count,
    entry_point=entry_script,
    source_dir="demo",
    profiler_config=profiler_config,
    script_mode=True,
    hyperparameters=hyperparameters,
    input_mode="Pipe",
)
If you see an error,
TypeError: __init__() got an unexpected keyword argument 'instance_type', that means SageMaker Python SDK is out-dated. Please update your SageMaker Python SDK to 2.x by executing the below command and restart this notebook.
pip install --upgrade sagemaker
Start training job
The following estimator.fit() with wait=False argument initiates the training job in the background. You can proceed to run the dashboard or analysis notebooks.
[ ]:
remote_inputs = {"train": dataset_location + "/train"}

estimator.fit(remote_inputs, wait=False)
3. Monitor the system resource utilization using SageMaker Studio
SageMaker Studio provides the visualization tool for Sagemaker Debugger, where you can find the analysis report and plots of the system and framework performance metrics.
To access this information in SageMaker Studio, click on the last icon on the left to open SageMaker Components and registries and choose Experiments and trials. You will see the list of training jobs. Right click on the job you want to investigate shows a pop-up menu, then click on Open Debugger for insights which opens a new tap for SageMaker Debugger as below.
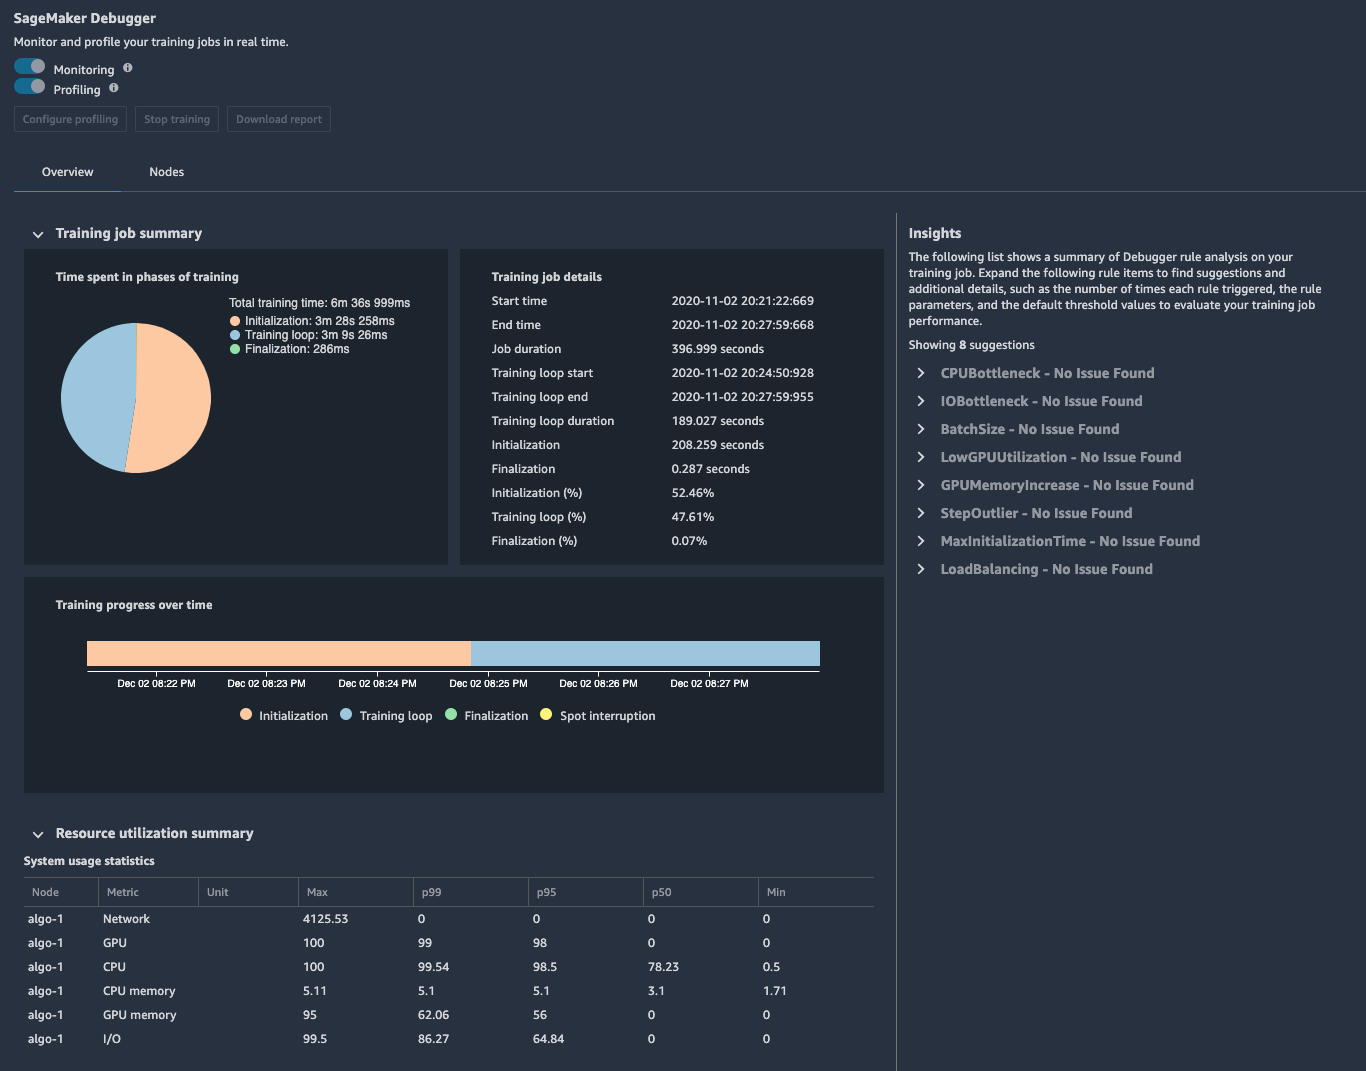
There are two tabs, Overview and Nodes. Overview gives profiling summaries for quick review, and Nodes gives a detailed utilization information on all nodes.
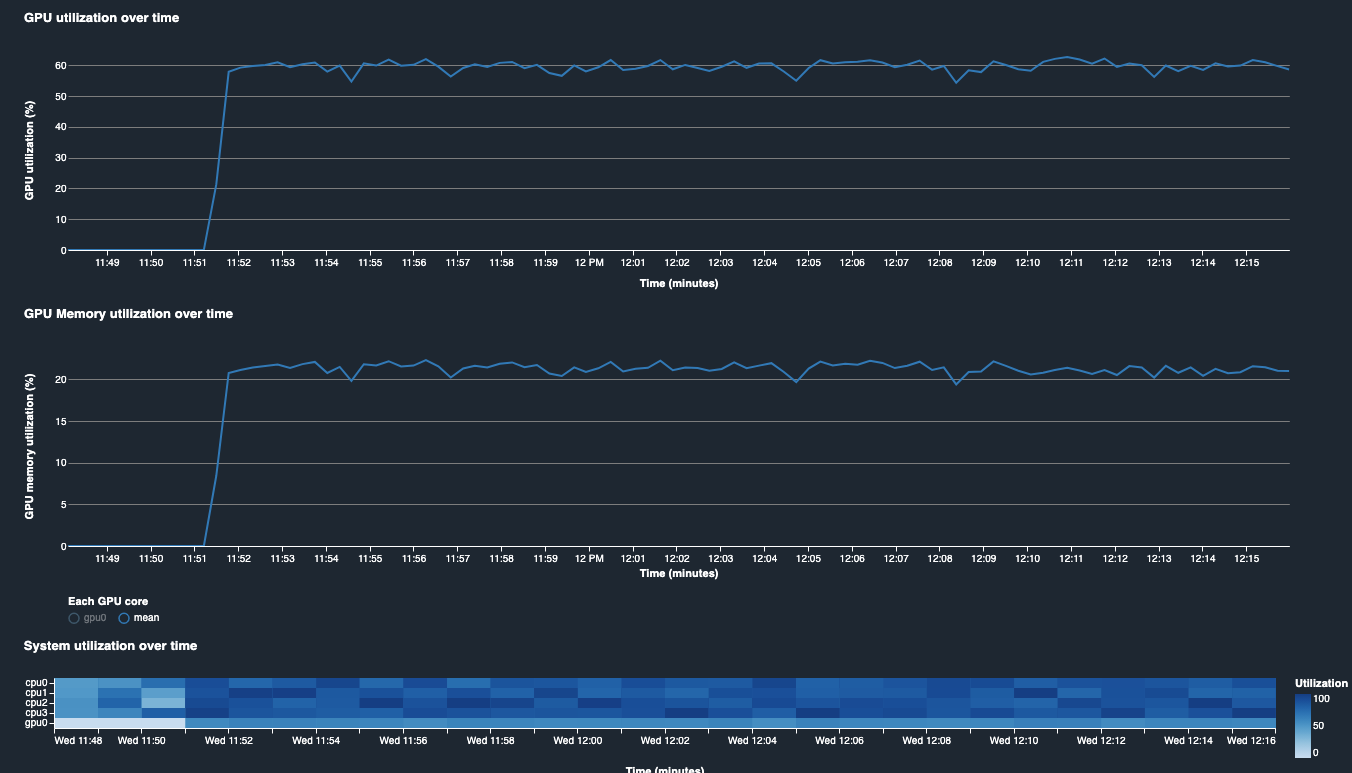
GPU and system utilization history found in Nodes, indicate that our GPU was under-utilized. GPU utilization was 60% and GPU Memory utilization was 20%.
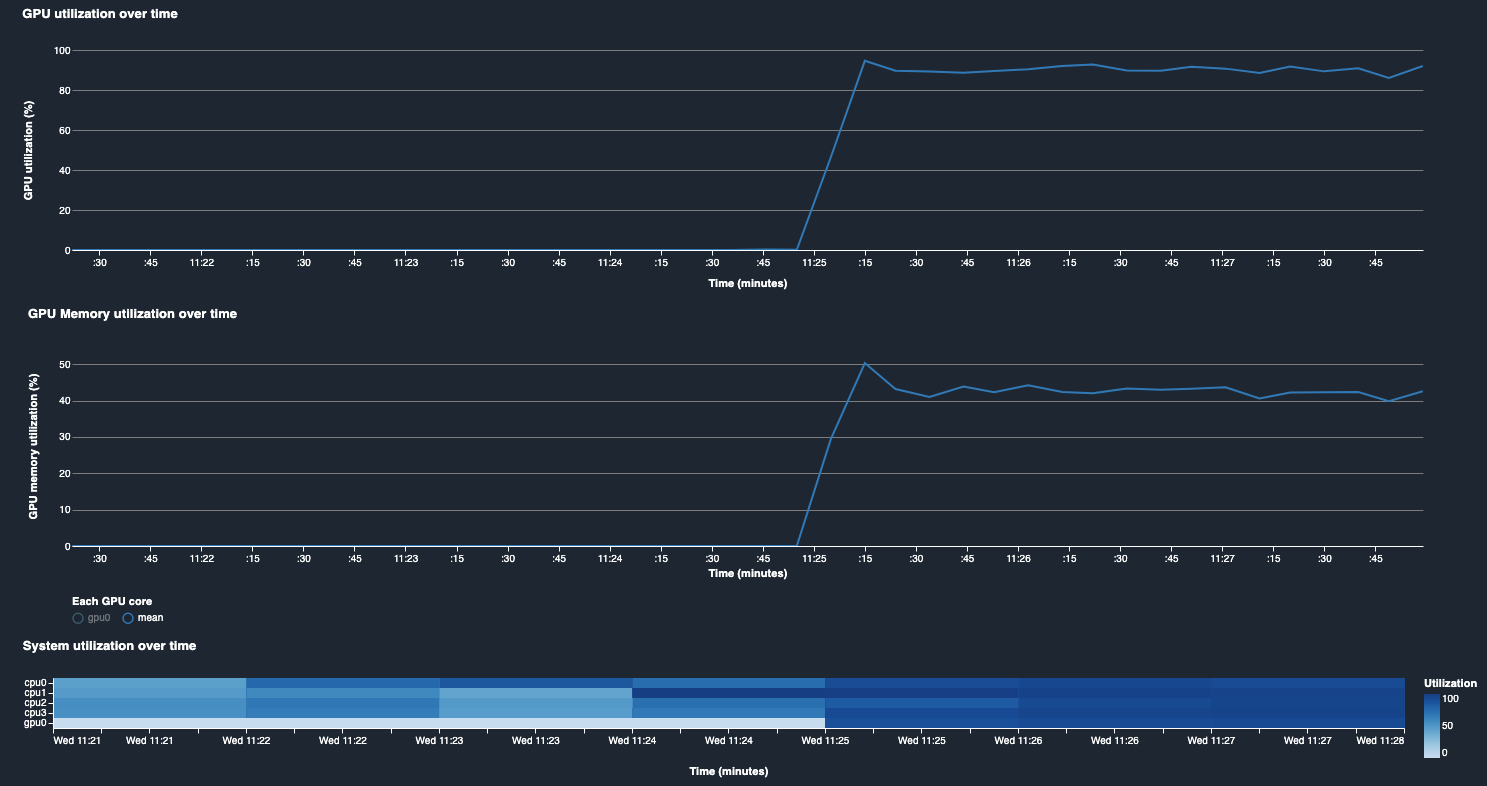
The first action to be taken in this case is to increase the batch size to push more examples to GPU. In this example, you can increase the batch size by changing a value of a hyperparemter and run the training job again. For example, change batch_size from 64 to 1024.
hyperparameters = {'epoch': 20,
                   'batch_size': 1024
                  }
The system resouce utilization with batch size 1024 shows fully utilized GPU as in the following plot.
Notebook CI Test Results
This notebook was tested in multiple regions. The test results are as follows, except for us-west-2 which is shown at the top of the notebook.