SageMaker Clarify Online Explainability on Multi-Model Endpoint
This notebook’s CI test result for us-west-2 is as follows. CI test results in other regions can be found at the end of the notebook.
Runtime
This notebook takes approximately 20 minutes to run
Contents
Introduction
Amazon SageMaker Clarify helps improve your machine learning models by detecting potential bias and helping explain how these models make predictions. The fairness and explainability functionality provided by SageMaker Clarify takes a step towards enabling AWS customers to build trustworthy and understandable machine learning models. Customers can now configure Online Explainability with SageMaker Clarify on SageMaker real-time inference endpoints.
With Amazon SageMaker multi-model endpoints, customers can create an endpoint that seamlessly hosts up to thousands of models. These endpoints are well suited to use cases where any one of many models is needed, which can be served from a common inference container to save inference costs, needs to be invoked on-demand and where it is acceptable for infrequently invoked models to incur some additional latency. For applications which require consistently low inference latency, an endpoint deploying a single model is still the best choice.
This example notebook showcases how to create a multi-model endpoint with online explainability enabled. To demonstrate how multi-model endpoints are created and used, this notebook provides an example using a set of XGBoost models that each predict housing prices for a single location. Then the example notebook walks you through key terms and concepts needed to understand SageMaker Clarify, create an endpoint configuration with the new SageMaker Clarify explainer configuration and create an endpoint using the same explainer configuration.
General Setup
We recommend you use Python 3 (Data Science) kernel on SageMaker Studio or conda_python3 kernel on SageMaker Notebook Instance.
Install dependencies
[1]:
! pip install --upgrade -r requirements.txt --quiet
Import libraries
[2]:
import boto3
import io
import os
import sagemaker
import shutil
import time
import pprint
import pandas as pd
import numpy as np
from sagemaker import get_execution_role, image_uris, Session
from sagemaker.deserializers import JSONDeserializer
from sagemaker.serializers import CSVSerializer
from sagemaker.utils import unique_name_from_base
from sklearn.model_selection import train_test_split
Set configurations
[3]:
boto3_session = boto3.session.Session()
sagemaker_client = boto3.client("sagemaker")
sagemaker_runtime_client = boto3.client("sagemaker-runtime")

# Initialize sagemaker session
sagemaker_session = Session(
    boto_session=boto3_session,
    sagemaker_client=sagemaker_client,
    sagemaker_runtime_client=sagemaker_runtime_client,
)

region = sagemaker_session.boto_region_name
print(f"Region: {region}")

role = get_execution_role()
print(f"Role: {role}")

s3 = boto3.resource("s3")
bucket = sagemaker_session.default_bucket()

prefix = unique_name_from_base("DEMO-MME-OnlineExplainability")
multi_model_artifacts = "multi_model_artifacts"

model_name = f"{prefix}-model"
print(f"Demo model name: {model_name}")
endpoint_config_name = f"{prefix}-endpoint-config"
print(f"Demo endpoint config name: {endpoint_config_name}")
endpoint_name = f"{prefix}-endpoint"
print(f"Demo endpoint name: {endpoint_name}")

# Instance type for training and hosting
instance_type = "ml.m5.xlarge"
Region: us-west-2
Role: arn:aws:iam::003394947794:role/service-role/SMClarifySageMaker-ExecutionRole
Demo model name: DEMO-MME-OnlineExplainability-1686294517-e9d4-model
Demo endpoint config name: DEMO-MME-OnlineExplainability-1686294517-e9d4-endpoint-config
Demo endpoint name: DEMO-MME-OnlineExplainability-1686294517-e9d4-endpoint
Create serializer and deserializer
CSV serializer to serialize test data to string
[4]:
csv_serializer = CSVSerializer()
JSON deserializer to deserialize invoke endpoint response
[5]:
json_deserializer = JSONDeserializer()
For visualization
SHAP plots are useful visualization tools to interpret the explanations. For example, SHAP additive force layout shows how each feature contributes to pushing the base value (also called the expected value which is the mean predictions of the training dataset) to the corresponding prediction. Features that push the prediction higher are in red color, while those push the prediction lower are in blue.
[6]:
%run visualization_utils.py
Prepare data
The code below contains helper functions to prepare data in the form of a 1x7 NumPy array representing the features of a house.
The first entry in the array is the randomly generated price of a house. The remaining entries are the features (i.e. number of bedroom, square feet, number of bathrooms, etc.).
These functions will be used to prepare data for training, validation, and testing. It will also allow us to submit payloads for inference to test our multi-model endpoint.
Note: The content of this section is referred from an existing multi-model endpoint example notebook.
[7]:
NUM_HOUSES_PER_LOCATION = 1000
LOCATIONS = [
    "NewYork_NY",
    "LosAngeles_CA",
    "Chicago_IL",
    "Houston_TX",
    "Dallas_TX",
    "Phoenix_AZ",
    "Philadelphia_PA",
    "SanAntonio_TX",
    "SanDiego_CA",
    "SanFrancisco_CA",
]
PARALLEL_TRAINING_JOBS = 4  # len(LOCATIONS) if your account limits can handle it
MAX_YEAR = 2022
FEATURE_HEADERS = [
    "YEAR_BUILT",
    "SQUARE_FEET",
    "NUM_BEDROOMS",
    "NUM_BATHROOMS",
    "LOT_ACRES",
    "GARAGE_SPACES",
]
[8]:
def gen_price(house):
    _base_price = int(house["SQUARE_FEET"] * 150)
    _price = int(
        _base_price
        + (10000 * house["NUM_BEDROOMS"])
        + (15000 * house["NUM_BATHROOMS"])
        + (15000 * house["LOT_ACRES"])
        + (15000 * house["GARAGE_SPACES"])
        - (5000 * (MAX_YEAR - house["YEAR_BUILT"]))
    )
    return _price
[9]:
def gen_random_house():
    _house = {
        "SQUARE_FEET": int(np.random.normal(3000, 750)),
        "NUM_BEDROOMS": np.random.randint(2, 7),
        "NUM_BATHROOMS": np.random.randint(2, 7) / 2,
        "LOT_ACRES": round(np.random.normal(1.0, 0.25), 2),
        "GARAGE_SPACES": np.random.randint(0, 4),
        "YEAR_BUILT": min(MAX_YEAR, int(np.random.normal(1995, 10))),
    }
    _price = gen_price(_house)
    return [
        _price,
        _house["YEAR_BUILT"],
        _house["SQUARE_FEET"],
        _house["NUM_BEDROOMS"],
        _house["NUM_BATHROOMS"],
        _house["LOT_ACRES"],
        _house["GARAGE_SPACES"],
    ]
[10]:
def gen_houses(num_houses):
    _house_list = []
    for i in range(num_houses):
        _house_list.append(gen_random_house())
    _df = pd.DataFrame(
        _house_list,
        columns=[
            "PRICE",
            "YEAR_BUILT",
            "SQUARE_FEET",
            "NUM_BEDROOMS",
            "NUM_BATHROOMS",
            "LOT_ACRES",
            "GARAGE_SPACES",
        ],
    )
    return _df
Split a given dataset into train, validation, and test
The code below will generate three sets of data. One set to train, one set for validation and one for testing.
[11]:
SEED = 7
SPLIT_RATIOS = [0.6, 0.3, 0.1]


def split_data(df):
    # split data into train and test sets
    seed = SEED
    val_size = SPLIT_RATIOS[1]
    test_size = SPLIT_RATIOS[2]

    num_samples = df.shape[0]
    X1 = df.values[:num_samples, 1:]  # keep only the features, skip the target, all rows
    Y1 = df.values[:num_samples, :1]  # keep only the target, all rows

    # Use split ratios to divide up into train/val/test
    X_train, X_val, y_train, y_val = train_test_split(
        X1, Y1, test_size=(test_size + val_size), random_state=seed
    )
    # Of the remaining non-training samples, give proper ratio to validation and to test
    X_test, X_test, y_test, y_test = train_test_split(
        X_val, y_val, test_size=(test_size / (test_size + val_size)), random_state=seed
    )
    # reassemble the datasets with target in first column and features after that
    _train = np.concatenate([y_train, X_train], axis=1)
    _val = np.concatenate([y_val, X_val], axis=1)
    _test = np.concatenate([y_test, X_test], axis=1)

    return _train, _val, _test
Train multiple house value prediction models
In the follow section, we are setting up the code to train a house price prediction model for each of 4 different cities.
As such, we will launch multiple training jobs asynchronously, using the XGBoost algorithm.
In this notebook, we will be using the AWS Managed XGBoost Image for both training and inference - this image provides native support for launching multi-model endpoints.
Note: The content of this section is referred from an existing multi-model endpoint example notebook.
[12]:
# This is references the AWS managed XGBoost container
xgboost_image = image_uris.retrieve(
    region=boto3.Session().region_name, framework="xgboost", version="1.5-1"
)
xgboost_image
[12]:
'246618743249.dkr.ecr.us-west-2.amazonaws.com/sagemaker-xgboost:1.5-1'
Launch a single training job for a given housing location
There is nothing specific to multi-model endpoints in terms of the models it will host. They are trained in the same way as all other SageMaker models. Here we are using the XGBoost estimator and not waiting for the job to complete.
[13]:
def launch_training_job(location):
    # clear out old versions of the data
    s3_bucket = s3.Bucket(bucket)
    full_input_prefix = f"{prefix}/model_prep/{location}"
    s3_bucket.objects.filter(Prefix=full_input_prefix + "/").delete()

    # upload the entire set of data for all three channels
    local_folder = f"data/{location}"
    inputs = sagemaker_session.upload_data(path=local_folder, key_prefix=full_input_prefix)
    print(f"Training data uploaded: {inputs}")

    _job = "xgb-{}".format(location.replace("_", "-"))
    full_output_prefix = f"{prefix}/model_artifacts/{location}"
    s3_output_path = f"s3://{bucket}/{full_output_prefix}"

    xgb = sagemaker.estimator.Estimator(
        xgboost_image,
        role,
        instance_count=1,
        instance_type=instance_type,
        output_path=s3_output_path,
        base_job_name=_job,
        sagemaker_session=sagemaker_session,
    )

    xgb.set_hyperparameters(
        max_depth=5,
        eta=0.2,
        gamma=4,
        min_child_weight=6,
        subsample=0.8,
        verbosity=0,
        early_stopping_rounds=5,
        objective="reg:squarederror",
        num_round=25,
    )

    DISTRIBUTION_MODE = "FullyReplicated"

    train_input = sagemaker.inputs.TrainingInput(
        s3_data=inputs + "/train", distribution=DISTRIBUTION_MODE, content_type="csv"
    )

    val_input = sagemaker.inputs.TrainingInput(
        s3_data=inputs + "/val", distribution=DISTRIBUTION_MODE, content_type="csv"
    )

    remote_inputs = {"train": train_input, "validation": val_input}

    xgb.fit(remote_inputs, wait=False)

    # Return the estimator object
    return xgb
Kick off a model training job for each housing location
[14]:
def save_data_locally(location, train, val, test):
    os.makedirs(f"data/{location}/train")
    np.savetxt(f"data/{location}/train/{location}_train.csv", train, delimiter=",", fmt="%.2f")

    os.makedirs(f"data/{location}/val")
    np.savetxt(f"data/{location}/val/{location}_val.csv", val, delimiter=",", fmt="%.2f")

    os.makedirs(f"data/{location}/test")
    np.savetxt(f"data/{location}/test/{location}_test.csv", test, delimiter=",", fmt="%.2f")
[15]:
estimators = []

shutil.rmtree("data", ignore_errors=True)

for loc in LOCATIONS[:PARALLEL_TRAINING_JOBS]:
    _houses = gen_houses(NUM_HOUSES_PER_LOCATION)
    _train, _val, _test = split_data(_houses)
    save_data_locally(loc, _train, _val, _test)
    estimator = launch_training_job(loc)
    estimators.append(estimator)

print()
print(
    f"{len(estimators)} training jobs launched: {[x.latest_training_job.job_name for x in estimators]}"
)
INFO:sagemaker:Creating training-job with name: xgb-NewYork-NY-2023-06-09-07-08-39-077
Training data uploaded: s3://sagemaker-us-west-2-003394947794/DEMO-MME-OnlineExplainability-1686294517-e9d4/model_prep/NewYork_NY
INFO:sagemaker:Creating training-job with name: xgb-LosAngeles-CA-2023-06-09-07-08-39-518
Training data uploaded: s3://sagemaker-us-west-2-003394947794/DEMO-MME-OnlineExplainability-1686294517-e9d4/model_prep/LosAngeles_CA
INFO:sagemaker:Creating training-job with name: xgb-Chicago-IL-2023-06-09-07-08-41-623
Training data uploaded: s3://sagemaker-us-west-2-003394947794/DEMO-MME-OnlineExplainability-1686294517-e9d4/model_prep/Chicago_IL
INFO:sagemaker:Creating training-job with name: xgb-Houston-TX-2023-06-09-07-08-42-089
Training data uploaded: s3://sagemaker-us-west-2-003394947794/DEMO-MME-OnlineExplainability-1686294517-e9d4/model_prep/Houston_TX

4 training jobs launched: ['xgb-NewYork-NY-2023-06-09-07-08-39-077', 'xgb-LosAngeles-CA-2023-06-09-07-08-39-518', 'xgb-Chicago-IL-2023-06-09-07-08-41-623', 'xgb-Houston-TX-2023-06-09-07-08-42-089']
Wait for all model training to finish
[16]:
# The job takes about 10 minutes to run
def wait_for_training_job_to_complete(estimator):
    job = estimator.latest_training_job.job_name
    print(f"Waiting for job: {job}")
    status = estimator.latest_training_job.describe()["TrainingJobStatus"]
    while status == "InProgress":
        time.sleep(45)
        status = estimator.latest_training_job.describe()["TrainingJobStatus"]
        if status == "InProgress":
            print(f"{job} job status: {status}")
    print(f"DONE. Status for {job} is {status}\n")
[17]:
for est in estimators:
    wait_for_training_job_to_complete(est)
Waiting for job: xgb-NewYork-NY-2023-06-09-07-08-39-077
xgb-NewYork-NY-2023-06-09-07-08-39-077 job status: InProgress
xgb-NewYork-NY-2023-06-09-07-08-39-077 job status: InProgress
xgb-NewYork-NY-2023-06-09-07-08-39-077 job status: InProgress
DONE. Status for xgb-NewYork-NY-2023-06-09-07-08-39-077 is Completed

Waiting for job: xgb-LosAngeles-CA-2023-06-09-07-08-39-518
DONE. Status for xgb-LosAngeles-CA-2023-06-09-07-08-39-518 is Completed

Waiting for job: xgb-Chicago-IL-2023-06-09-07-08-41-623
DONE. Status for xgb-Chicago-IL-2023-06-09-07-08-41-623 is Completed

Waiting for job: xgb-Houston-TX-2023-06-09-07-08-42-089
DONE. Status for xgb-Houston-TX-2023-06-09-07-08-42-089 is Completed
Move model artifacts to an S3 location
[18]:
# This is where our MME will read models from on S3.
model_data_prefix = f"s3://{bucket}/{prefix}/{multi_model_artifacts}/"

from urllib.parse import urlparse

for est in estimators:
    artifact_path = est.latest_training_job.describe()["ModelArtifacts"]["S3ModelArtifacts"]
    model_file_name = artifact_path.split("/")[-4] + ".tar.gz"
    url_object = urlparse(artifact_path, allow_fragments=False)
    copy_source = {"Bucket": bucket, "Key": url_object.path[1:]}
    s3.meta.client.copy(copy_source, bucket, f"{prefix}/{multi_model_artifacts}/{model_file_name}")
Create Endpoint
Create model
The following parameters are required to create SageMaker model for multi-model use case:
ExecutionRoleArn: The ARN of the IAM role that Amazon SageMaker can assume to access the model artifacts/ docker images for deploymentModelName: Name of the SageMaker model.Containers: Array of ContainerDefinition objects. For multi-model endpoint use case there should be a container withModeasMultiModel.
[19]:
container = {"Image": xgboost_image, "ModelDataUrl": model_data_prefix, "Mode": "MultiModel"}
response = sagemaker_client.create_model(
    ModelName=model_name, ExecutionRoleArn=role, Containers=[container]
)
Create endpoint config
Create an endpoint configuration by calling the create_endpoint_config API. Here, supply the same model_name used in the create_model API call. The create_endpoint_config now supports the additional parameter ClarifyExplainerConfig to enable the Clarify explainer. The SHAP baseline is mandatory, it can be provided either as inline baseline data (the ShapBaseline parameter) or by a S3 baseline file (the ShapBaselineUri parameter). Baseline dataset type shall be the
same as input dataset type, and baseline samples shall only include features. For more details on baseline selection please refer this documentation.
Please see the API documentation for details on other config parameters.
[20]:
# For our use case here we will choose a baseline, as per the average of the ranges we used, while
# generating random house dataset above.
baseline = [1995, 3000, 4, 2, 1, 2]
[21]:
create_endpoint_config_response = sagemaker_client.create_endpoint_config(
    EndpointConfigName=endpoint_config_name,
    ProductionVariants=[
        {
            "InstanceType": instance_type,
            "InitialInstanceCount": 1,
            "InitialVariantWeight": 1,
            "ModelName": model_name,
            "VariantName": "AllTraffic",
        }
    ],
    ExplainerConfig={
        "ClarifyExplainerConfig": {
            "ShapConfig": {
                "ShapBaselineConfig": {"ShapBaseline": csv_serializer.serialize(baseline)}
            },
            "InferenceConfig": {"FeatureHeaders": FEATURE_HEADERS},
        }
    },
)

print("Endpoint config ARN: " + create_endpoint_config_response["EndpointConfigArn"])
Endpoint config ARN: arn:aws:sagemaker:us-west-2:003394947794:endpoint-config/demo-mme-onlineexplainability-1686294517-e9d4-endpoint-config
Create endpoint
Once you have your model and endpoint configuration ready, use the create_endpoint API to create your endpoint. The endpoint_name must be unique within an AWS Region in your AWS account. The create_endpoint API is synchronous in nature and returns an immediate response with the endpoint status being Creating state.
[22]:
sagemaker_client.create_endpoint(
    EndpointName=endpoint_name,
    EndpointConfigName=endpoint_config_name,
)
[22]:
{'EndpointArn': 'arn:aws:sagemaker:us-west-2:003394947794:endpoint/demo-mme-onlineexplainability-1686294517-e9d4-endpoint',
 'ResponseMetadata': {'RequestId': 'ca69256c-60fc-4433-ab4d-2dbcd5ff82a5',
  'HTTPStatusCode': 200,
  'HTTPHeaders': {'x-amzn-requestid': 'ca69256c-60fc-4433-ab4d-2dbcd5ff82a5',
   'content-type': 'application/x-amz-json-1.1',
   'content-length': '122',
   'date': 'Fri, 09 Jun 2023 07:11:44 GMT'},
  'RetryAttempts': 0}}
Wait for the endpoint to be in “In-Service” state.
[23]:
# Endpoint creation can take about 5 minutes to complete
sagemaker_session.wait_for_endpoint(endpoint_name)
----!
[23]:
{'EndpointName': 'DEMO-MME-OnlineExplainability-1686294517-e9d4-endpoint',
 'EndpointArn': 'arn:aws:sagemaker:us-west-2:003394947794:endpoint/demo-mme-onlineexplainability-1686294517-e9d4-endpoint',
 'EndpointConfigName': 'DEMO-MME-OnlineExplainability-1686294517-e9d4-endpoint-config',
 'ProductionVariants': [{'VariantName': 'AllTraffic',
   'DeployedImages': [{'SpecifiedImage': '246618743249.dkr.ecr.us-west-2.amazonaws.com/sagemaker-xgboost:1.5-1',
     'ResolvedImage': '246618743249.dkr.ecr.us-west-2.amazonaws.com/sagemaker-xgboost@sha256:96b7f3eb2f971484a3d3596b735c297ea7977901f939e3edc382c4c40983244e',
     'ResolutionTime': datetime.datetime(2023, 6, 9, 7, 11, 45, 730000, tzinfo=tzlocal())}],
   'CurrentWeight': 1.0,
   'DesiredWeight': 1.0,
   'CurrentInstanceCount': 1,
   'DesiredInstanceCount': 1}],
 'EndpointStatus': 'InService',
 'CreationTime': datetime.datetime(2023, 6, 9, 7, 11, 45, 127000, tzinfo=tzlocal()),
 'LastModifiedTime': datetime.datetime(2023, 6, 9, 7, 13, 59, 289000, tzinfo=tzlocal()),
 'ExplainerConfig': {'ClarifyExplainerConfig': {'InferenceConfig': {'FeatureHeaders': ['YEAR_BUILT',
     'SQUARE_FEET',
     'NUM_BEDROOMS',
     'NUM_BATHROOMS',
     'LOT_ACRES',
     'GARAGE_SPACES']},
   'ShapConfig': {'ShapBaselineConfig': {'ShapBaseline': '1995,3000,4,2,1,2'}}}},
 'ResponseMetadata': {'RequestId': '74a2c4a8-897d-4edd-bd40-49d2ee440df8',
  'HTTPStatusCode': 200,
  'HTTPHeaders': {'x-amzn-requestid': '74a2c4a8-897d-4edd-bd40-49d2ee440df8',
   'content-type': 'application/x-amz-json-1.1',
   'content-length': '1058',
   'date': 'Fri, 09 Jun 2023 07:14:16 GMT'},
  'RetryAttempts': 0}}
Invoke endpoint
There are expanding business needs and legislative regulations that require explanations of why a model made the decision it did. SageMaker Clarify uses SHAP to explain the contribution that each input feature makes to the final decision.
Below are the several combinations of endpoint invocation, call them one by one and visualize the explanations by running the subsequent cell.
Single record request: First Model
Put only one record in the request body, and then send the request to the endpoint to get its predictions and explanations. Invoke for a particular model by specifying TargetModel in request object. For this example we will be invoking for model: Chicago_IL.tar.gz
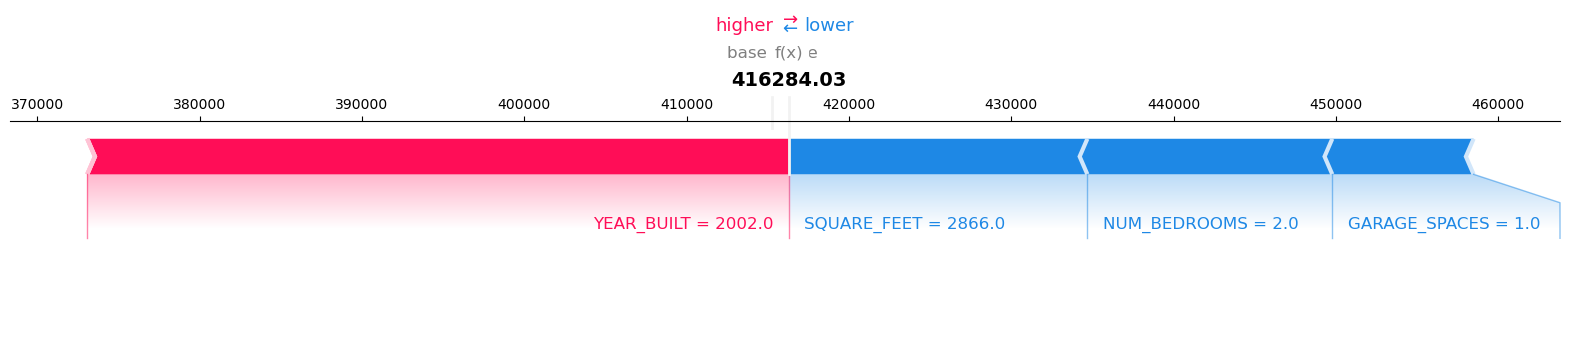
We can use SHAP plots to visualize the result. SHAP additive force layout shows how each feature contributes to pushing the base value (also called the expected value which is the mean predictions of the training dataset) to the corresponding prediction. Features that push the prediction higher are in red color, while those push the prediction lower are in blue.
The expected value is the average of the model predictions over the baseline. Here we predict the baseline data and then compute the expected value. Only the predictions are needed, so the EnableExplanations parameter is used to disable the explanations.
[24]:
response = sagemaker_runtime_client.invoke_endpoint(
    EndpointName=endpoint_name,
    ContentType="text/csv",
    TargetModel="Chicago_IL.tar.gz",
    Accept="text/csv",
    Body=csv_serializer.serialize(baseline),
    EnableExplanations="`false`",  # Do not provide explanations
)
json_object = json_deserializer.deserialize(response["Body"], content_type=response["ContentType"])
expected_value = float(
    pd.read_csv(io.StringIO(json_object["predictions"]["data"]), header=None)
    .astype(float)
    .mean(axis=1)
)
print(f"expected value: {expected_value}")
expected value: 415274.28125
Calling float on a single element Series is deprecated and will raise a TypeError in the future. Use float(ser.iloc[0]) instead
Invoke endpoint with explanations enabled and visualize results.
[25]:
request_records = pd.DataFrame([gen_random_house()[1:]])
[26]:
response = sagemaker_runtime_client.invoke_endpoint(
    EndpointName=endpoint_name,
    ContentType="text/csv",
    TargetModel="Chicago_IL.tar.gz",
    Accept="text/csv",
    Body=csv_serializer.serialize(request_records.to_numpy()),
)
pprint.pprint(response)
{'Body': <botocore.response.StreamingBody object at 0x7f89a9b4a020>,
 'ContentType': 'application/json',
 'InvokedProductionVariant': 'AllTraffic',
 'ResponseMetadata': {'HTTPHeaders': {'content-length': '641',
                                      'content-type': 'application/json',
                                      'date': 'Fri, 09 Jun 2023 07:14:17 GMT',
                                      'x-amzn-invoked-production-variant': 'AllTraffic',
                                      'x-amzn-requestid': '94805904-8c4b-417c-94dc-63c2b1b4c811'},
                      'HTTPStatusCode': 200,
                      'RequestId': '94805904-8c4b-417c-94dc-63c2b1b4c811',
                      'RetryAttempts': 0}}
Print the response body which is JSON. Please see the API documentation for its schema.
[27]:
result = json_deserializer.deserialize(response["Body"], content_type=response["ContentType"])
pprint.pprint(result)
{'explanations': {'kernel_shap': [[{'attributions': [{'attribution': [43204.68750000001]}],
                                    'feature_header': 'YEAR_BUILT'},
                                   {'attributions': [{'attribution': [-18403.078124999996]}],
                                    'feature_header': 'SQUARE_FEET'},
                                   {'attributions': [{'attribution': [-15086.921875]}],
                                    'feature_header': 'NUM_BEDROOMS'},
                                   {'attributions': [{'attribution': [3.637978807091713e-12]}],
                                    'feature_header': 'NUM_BATHROOMS'},
                                   {'attributions': [{'attribution': [5.4569682106375694e-12]}],
                                    'feature_header': 'LOT_ACRES'},
                                   {'attributions': [{'attribution': [-8704.93750000002]}],
                                    'feature_header': 'GARAGE_SPACES'}]]},
 'predictions': {'content_type': 'text/csv', 'data': '416284.03125'},
 'version': '1.0'}
[28]:
visualize_result(result, request_records, expected_value)
Model Inference output:
Record: 1       Model Prediction: 416284.03125
Visualize the SHAP values for Record number 1 with Model Prediction: 416284.03125
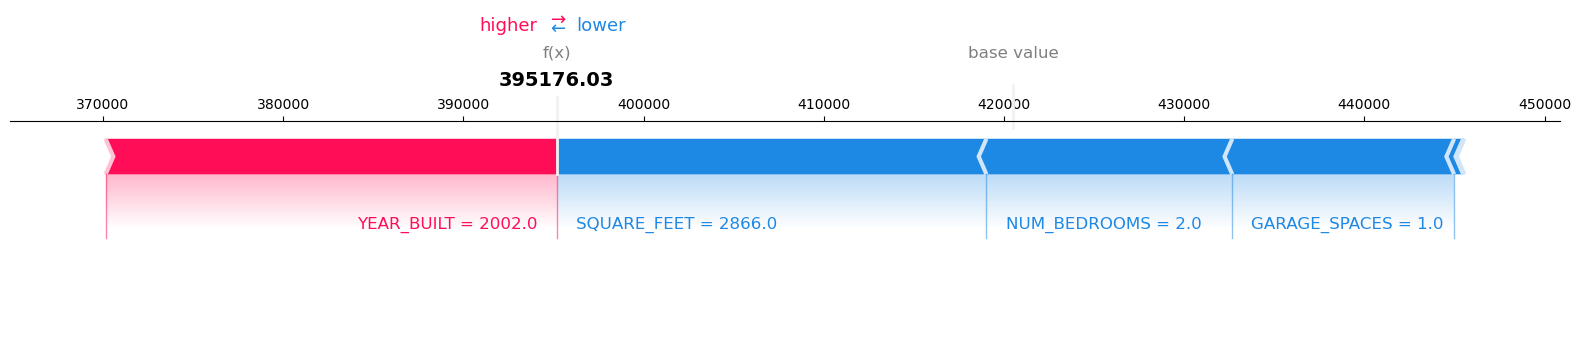
Single record request: Second Model
Get inference and explanations for same request record with a different model by changing the TargetModel. For this example we will be invoking for model: Houston_TX.tar.gz. As we are using a different model, results may change for the same baseline.
[29]:
# Get expected value for the same baseline
response = sagemaker_runtime_client.invoke_endpoint(
    EndpointName=endpoint_name,
    ContentType="text/csv",
    TargetModel="Houston_TX.tar.gz",
    Accept="text/csv",
    Body=csv_serializer.serialize(baseline),
    EnableExplanations="`false`",  # Do not provide explanations
)
json_object = json_deserializer.deserialize(response["Body"], content_type=response["ContentType"])
expected_value = float(
    pd.read_csv(io.StringIO(json_object["predictions"]["data"]), header=None)
    .astype(float)
    .mean(axis=1)
)
print(f"expected value: {expected_value}")

# Invoke endpoint and visualise results
response = sagemaker_runtime_client.invoke_endpoint(
    EndpointName=endpoint_name,
    ContentType="text/csv",
    TargetModel="Houston_TX.tar.gz",
    Accept="text/csv",
    Body=csv_serializer.serialize(request_records.to_numpy()),
)
pprint.pprint(response)

result = json_deserializer.deserialize(response["Body"], content_type=response["ContentType"])
pprint.pprint(result)

visualize_result(result, request_records, expected_value)
Calling float on a single element Series is deprecated and will raise a TypeError in the future. Use float(ser.iloc[0]) instead
expected value: 420519.0625
{'Body': <botocore.response.StreamingBody object at 0x7f89a3f24070>,
 'ContentType': 'application/json',
 'InvokedProductionVariant': 'AllTraffic',
 'ResponseMetadata': {'HTTPHeaders': {'content-length': '641',
                                      'content-type': 'application/json',
                                      'date': 'Fri, 09 Jun 2023 07:14:19 GMT',
                                      'x-amzn-invoked-production-variant': 'AllTraffic',
                                      'x-amzn-requestid': 'a0660fe8-c65f-4ce7-b742-67444e96a322'},
                      'HTTPStatusCode': 200,
                      'RequestId': 'a0660fe8-c65f-4ce7-b742-67444e96a322',
                      'RetryAttempts': 0}}
{'explanations': {'kernel_shap': [[{'attributions': [{'attribution': [25031.116455078125]}],
                                    'feature_header': 'YEAR_BUILT'},
                                   {'attributions': [{'attribution': [-23850.23299153645]}],
                                    'feature_header': 'SQUARE_FEET'},
                                   {'attributions': [{'attribution': [-13642.174723307284]}],
                                    'feature_header': 'NUM_BEDROOMS'},
                                   {'attributions': [{'attribution': [-65.88305664062318]}],
                                    'feature_header': 'NUM_BATHROOMS'},
                                   {'attributions': [{'attribution': [-505.0638834635374]}],
                                    'feature_header': 'LOT_ACRES'},
                                   {'attributions': [{'attribution': [-12310.79305013023]}],
                                    'feature_header': 'GARAGE_SPACES'}]]},
 'predictions': {'content_type': 'text/csv', 'data': '395176.03125'},
 'version': '1.0'}
Model Inference output:
Record: 1       Model Prediction: 395176.03125
Visualize the SHAP values for Record number 1 with Model Prediction: 395176.03125
Single record request, no explanation
Use the EnableExplanations parameter to disable the explanations for this request.
[30]:
request_records = pd.DataFrame([gen_random_house()[1:]])
response = sagemaker_runtime_client.invoke_endpoint(
    EndpointName=endpoint_name,
    ContentType="text/csv",
    TargetModel="Houston_TX.tar.gz",
    Accept="text/csv",
    Body=csv_serializer.serialize(request_records.to_numpy()),
    EnableExplanations="`false`",  # Do not provide explanations
)
result = json_deserializer.deserialize(response["Body"], content_type=response["ContentType"])
pprint.pprint(result)
{'explanations': {},
 'predictions': {'content_type': 'text/csv', 'data': '414194.5625'},
 'version': '1.0'}
[31]:
visualize_result(result, request_records, expected_value)
Model Inference output:
Record: 1       Model Prediction: 414194.5625
No Clarify explanations for the record(s)
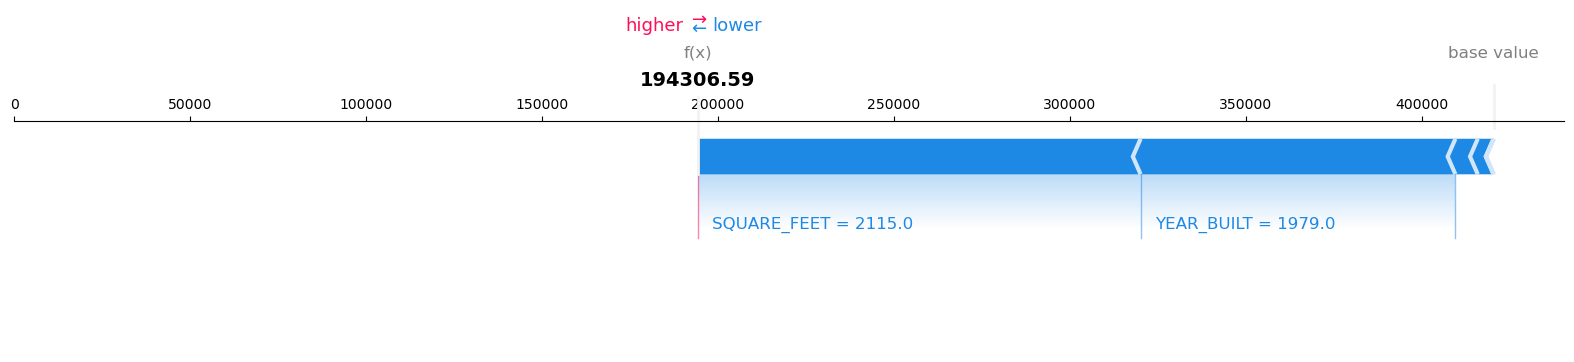
Batch request
Put multiple records in a single request and send the request to the endpoint to get their predictions and explanations.
[32]:
batch_size = 3
request_records = gen_houses(batch_size).iloc[:, 1:]
response = sagemaker_runtime_client.invoke_endpoint(
    EndpointName=endpoint_name,
    ContentType="text/csv",
    TargetModel="Houston_TX.tar.gz",
    Accept="text/csv",
    Body=csv_serializer.serialize(request_records.to_numpy()),
)
result = json_deserializer.deserialize(response["Body"], content_type=response["ContentType"])
pprint.pprint(result)
{'explanations': {'kernel_shap': [[{'attributions': [{'attribution': [-89483.4724527996]}],
                                    'feature_header': 'YEAR_BUILT'},
                                   {'attributions': [{'attribution': [-125814.63277180975]}],
                                    'feature_header': 'SQUARE_FEET'},
                                   {'attributions': [{'attribution': [-4479.94421386718]}],
                                    'feature_header': 'NUM_BEDROOMS'},
                                   {'attributions': [{'attribution': [-6356.896280924455]}],
                                    'feature_header': 'NUM_BATHROOMS'},
                                   {'attributions': [{'attribution': [-38.76151529948402]}],
                                    'feature_header': 'LOT_ACRES'},
                                   {'attributions': [{'attribution': [-38.76151529949857]}],
                                    'feature_header': 'GARAGE_SPACES'}],
                                  [{'attributions': [{'attribution': [-6339.592203776047]}],
                                    'feature_header': 'YEAR_BUILT'},
                                   {'attributions': [{'attribution': [-18094.009195963547]}],
                                    'feature_header': 'SQUARE_FEET'},
                                   {'attributions': [{'attribution': [24755.712646484386]}],
                                    'feature_header': 'NUM_BEDROOMS'},
                                   {'attributions': [{'attribution': [417.03361002604015]}],
                                    'feature_header': 'NUM_BATHROOMS'},
                                   {'attributions': [{'attribution': [-1032.1338704427108]}],
                                    'feature_header': 'LOT_ACRES'},
                                   {'attributions': [{'attribution': [-16445.79223632812]}],
                                    'feature_header': 'GARAGE_SPACES'}],
                                  [{'attributions': [{'attribution': [74820.17163085938]}],
                                    'feature_header': 'YEAR_BUILT'},
                                   {'attributions': [{'attribution': [15976.758056640625]}],
                                    'feature_header': 'SQUARE_FEET'},
                                   {'attributions': [{'attribution': [7329.774332682291]}],
                                    'feature_header': 'NUM_BEDROOMS'},
                                   {'attributions': [{'attribution': [-11230.087483723966]}],
                                    'feature_header': 'NUM_BATHROOMS'},
                                   {'attributions': [{'attribution': [-2591.009521484373]}],
                                    'feature_header': 'LOT_ACRES'},
                                   {'attributions': [{'attribution': [-19510.857014973953]}],
                                    'feature_header': 'GARAGE_SPACES'}]]},
 'predictions': {'content_type': 'text/csv',
                 'data': '194306.59375,403780.28125,485313.8125'},
 'version': '1.0'}
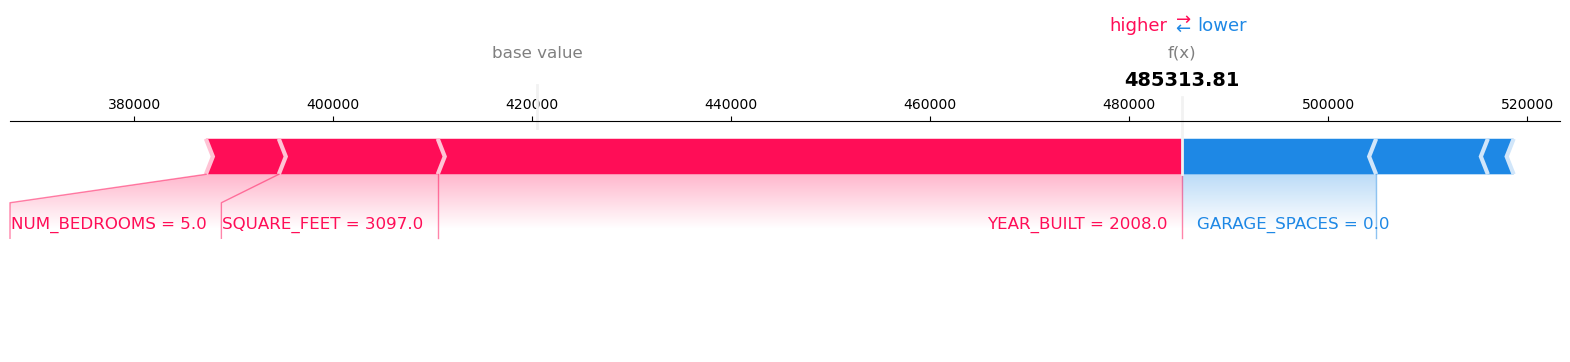
[33]:
visualize_result(result, request_records, expected_value)
Model Inference output:
Record: 1       Model Prediction: 194306.59375
Visualize the SHAP values for Record number 1 with Model Prediction: 194306.59375
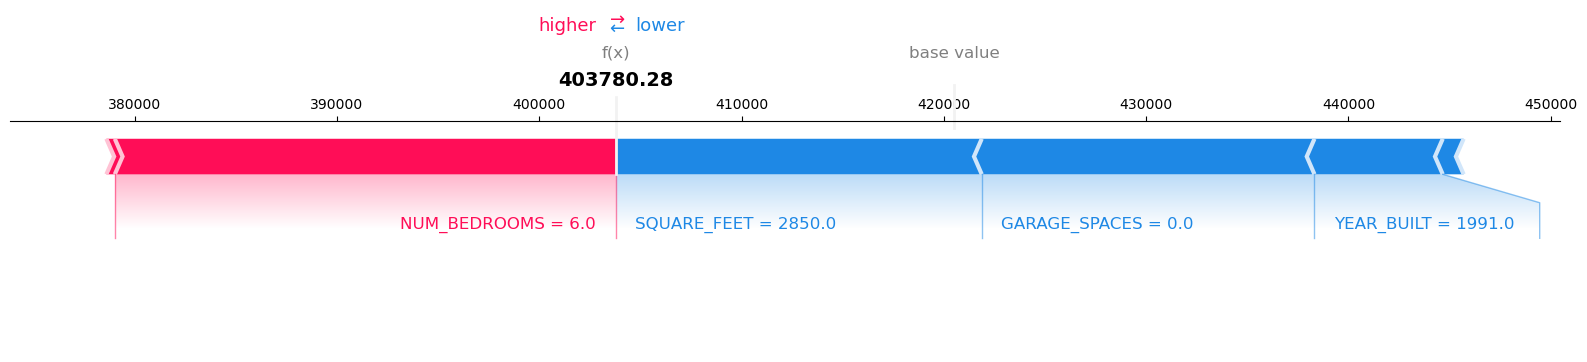
Visualize the SHAP values for Record number 2 with Model Prediction: 403780.28125
Visualize the SHAP values for Record number 3 with Model Prediction: 485313.8125
Cleanup
Finally, don’t forget to clean up the resources we set up and used for this demo!
[34]:
sagemaker_client.delete_endpoint(EndpointName=endpoint_name);
[35]:
sagemaker_client.delete_endpoint_config(EndpointConfigName=endpoint_config_name);
[36]:
sagemaker_client.delete_model(ModelName=model_name);
Notebook CI Test Results
This notebook was tested in multiple regions. The test results are as follows, except for us-west-2 which is shown at the top of the notebook.